visionDetectionGenerator
Generate vision detections for driving scenario or RoadRunner Scenario
Description
The visionDetectionGenerator
System object™ generates detections from a monocular camera sensor mounted on an ego
vehicle. All detections are referenced to the coordinate system of the ego vehicle or
the vehicle-mounted sensor. You can use the visionDetectionGenerator object in a scenario containing actors and
trajectories, which you can create by using a drivingScenario object. Using a statistical mode, the generator can
simulate real detections with added random noise and also generate false alarm
detections. In addition, you can use the visionDetectionGenerator object to create input to a multiObjectTracker. When building scenarios using the Driving Scenario
Designer app, the camera sensors mounted on the ego vehicle are output as
visionDetectionGenerator objects.
You can also use the visionDetectionGenerator object with vehicle actors in RoadRunner Scenario simulation. First you must create a SensorSimulation object to interface sensors with RoadRunner Scenario, and then register the sensor model using the addSensors object function before simulation.
To generate visual detections:
Create the
visionDetectionGeneratorobject and set its properties.Call the object with arguments, as if it were a function.
To learn more about how System objects work, see What Are System Objects?
Note
The sensor model created using visionDetectionGenerator is designed for applications with ground vehicles traveling on approximately flat surfaces.
Creation
Syntax
Description
sensor = visionDetectionGenerator
sensor = visionDetectionGenerator(cameraConfig)monoCamera configuration object,
cameraConfig.
sensor = visionDetectionGenerator(Name,Value)visionDetectionGenerator('DetectionCoordinates','Sensor
Cartesian','MaxRange',200) creates a vision detection generator
that reports detections in the sensor Cartesian coordinate system and has a
maximum detection range of 200 meters. Enclose each property name in
quotes.
Properties
Usage
Syntax
Description
dets = sensor(actors,time)dets, from sensor measurements
taken of actors at the current simulation
time. The object can generate sensor detections for
multiple actors simultaneously. Do not include the ego vehicle as one of the
actors.
To enable this syntax, set DetectionOutput to
'Objects only'.
lanedets = sensor(laneboundaries,time)lanedets, from lane boundary
structures, laneboundaries.
To enable this syntax set DetectionOutput to
'Lanes only'. The lane detector generates lane boundaries
at intervals specified by the LaneUpdateInterval
property.
lanedets = sensor(actors,laneboundaries,time)lanedets, from lane boundary
structures, laneboundaries.
To enable this syntax, set DetectionOutput to
'Lanes with occlusion'. The lane detector generates lane
boundaries at intervals specified by the LaneUpdateInterval
property.
[___,
also returns the number of valid detections reported,
numValidDets]
= sensor(___)numValidDets.
[___, also returns a logical value,
numValidDets,isValidTime]
= sensor(___)isValidTime, indicating that the
UpdateInterval time to generate detections has
elapsed.
[
returns both object detections, dets,numValidDets,isValidTime,lanedets,numValidLaneDets,isValidLaneTime] = sensor(actors,laneboundaries,time)dets, and lane detections
lanedets. This syntax also returns the number of valid
lane detections reported, numValidLaneDets, and a flag,
isValidLaneTime, indicating whether the required
simulation time to generate lane detections has elapsed.
To enable this syntax, set DetectionOutput to
'Lanes and
                            objects'
.
Input Arguments
Scenario actor poses, specified as a structure or structure array.
Each structure corresponds to an actor. You can generate this structure
using the actorPoses function.
You can also create these structures manually. The table shows the
fields that the object uses to generate detections. All other fields are
ignored.
| Field | Description |
|---|---|
ActorID | Scenario-defined actor identifier, specified as a positive integer. |
Position | Position of actor, specified as a real-valued vector of the form [x y z]. Units are in meters. |
Velocity | Velocity (v) of actor in the x- y-, and z-directions, specified as a real-valued vector of the form [vx vy vz]. Units are in meters per second. |
Roll | Roll angle of actor, specified as a real-valued scalar. Units are in degrees. |
Pitch | Pitch angle of actor, specified as a real-valued scalar. Units are in degrees. |
Yaw | Yaw angle of actor, specified as a real-valued scalar. Units are in degrees. |
AngularVelocity | Angular velocity (ω) of actor in the x-, y-, and z-directions, specified as a real-valued vector of the form [ωx ωy ωz]. Units are in degrees per second. |
For full definitions of the structure fields, see the actor and vehicle
functions.
Dependencies
To enable this argument, set the
DetectorOutput property to
'Objects only', 'Lanes with
occlusion', or 'Lanes and
objects'.
Lane boundaries, specified as an array of lane boundary structures. The table shows the fields for each structure.
| Field | Description |
| Lane boundary coordinates, specified as a real-valued N-by-3 matrix, where N is the number of lane boundary coordinates. Lane boundary coordinates define the position of points on the boundary at specified longitudinal distances away from the ego vehicle, along the center of the road.
This matrix also includes the boundary coordinates at zero distance from the ego vehicle. These coordinates are to the left and right of the ego-vehicle origin, which is located under the center of the rear axle. Units are in meters. |
| Lane boundary curvature at each row of the Coordinates matrix, specified
as a real-valued N-by-1 vector. N is the
number of lane boundary coordinates. Units are in radians per meter. |
| Derivative of lane boundary curvature at each row of the Coordinates
matrix, specified as a real-valued N-by-1 vector.
N is the number of lane boundary coordinates. Units are
in radians per square meter. |
| Initial lane boundary heading angle, specified as a real scalar. The heading angle of the lane boundary is relative to the ego vehicle heading. Units are in degrees. |
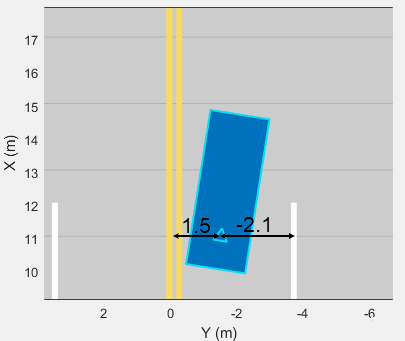
| Lateral offset of the ego vehicle position from the lane boundary, specified as a real scalar. An offset to a lane boundary to the left of the ego vehicle is positive. An offset to the right of the ego vehicle is negative. Units are in meters. In this image, the ego vehicle is offset 1.5 meters from the left lane and 2.1 meters from the right lane.
|
| Type of lane boundary marking, specified as one of these values:
|
| Saturation strength of the lane boundary marking, specified as a real scalar from 0 to
1. A value of |
| Lane boundary width, specified as a positive real scalar. In a double-line lane marker, the same width is used for both lines and for the space between lines. Units are in meters. |
| Length of dash in dashed lines, specified as a positive real scalar. In a double-line lane marker, the same length is used for both lines. |
| Length of space between dashes in dashed lines, specified as a positive real scalar. In a dashed double-line lane marker, the same space is used for both lines. |
Dependencies
To enable this argument, set the
DetectorOutput property to 'Lanes
only', 'Lanes with occlusion', or
'Lanes and
                                objects'
.
Data Types: struct
Current simulation time, specified as a positive real scalar. The
drivingScenario object
calls the vision detection generator at regular time intervals. The
vision detector generates new detections at intervals defined by the
UpdateInterval property. The values of the
UpdateInterval and
LanesUpdateInterval properties must be an
integer multiple of the simulation time interval. Updates requested from
the sensor between update intervals contain no detections. Units are in
seconds.
Example: 10.5
Data Types: double
Output Arguments
Object Functions
To use an object function, specify the
System object as the first input argument. For
example, to release system resources of a System object named obj, use
this syntax:
release(obj)
Examples
Generate detections using a forward-facing automotive vision sensor mounted on an ego vehicle. Assume that there are two target vehicles:
Vehicle 1 is directly in front of the ego vehicle and moving at the same speed.
Vehicle 2 vehicle is driving faster than the ego vehicle by 12 kph in the left lane.
All positions, velocities, and measurements are relative to the ego vehicle. Run the simulation for ten steps.
dt = 0.1;
car1 = struct('ActorID',1,'Position',[100 0 0],'Velocity', [5*1000/3600 0 0]);
car2 = struct('ActorID',2,'Position',[150 10 0],'Velocity',[12*1000/3600 0 0]);
Create an automotive vision sensor having a location offset from the ego vehicle. By default, the sensor location is at (3.4,0) meters from the vehicle center and 1.1 meters above the ground plane.
sensor = visionDetectionGenerator('DetectionProbability',1, ...
    'MinObjectImageSize',[5 5],'MaxRange',200,'DetectionCoordinates','Sensor Cartesian');
tracker = multiObjectTracker('FilterInitializationFcn',@initcvkf, ...
    'ConfirmationParameters',[3 4],'NumCoastingUpdates',6);
Generate visual detections for the non-ego actors as they move. The output detections form a cell array. Extract only position information from the detections to pass to the multiObjectTracker, which expects only position information. Then update the tracker for each new set of detections.
simTime = 0;
nsteps = 10;
for k = 1:nsteps
    dets = sensor([car1 car2],simTime);
    n = size(dets,1);
    for k = 1:n
        meas = dets{k}.Measurement(1:3);
        dets{k}.Measurement = meas;
        measmtx = dets{k}.MeasurementNoise(1:3,1:3);
        dets{k}.MeasurementNoise = measmtx;
    end
    [confirmedTracks,tentativeTracks,allTracks] = updateTracks(tracker,dets,simTime);
    simTime = simTime + dt;
    car1.Position = car1.Position + dt*car1.Velocity;
    car2.Position = car2.Position + dt*car2.Velocity;
end
Use birdsEyePlot to create an overhead view of the detections. Plot the sensor coverage area. Extract the x and y positions of the targets by converting the Measurement fields of the cell into a MATLAB® array. Then, plot the detections using birdsEyePlot functions.
BEplot = birdsEyePlot('XLim',[0 220],'YLim',[-75 75]);
caPlotter = coverageAreaPlotter(BEplot,'DisplayName','Vision Coverage Area');
plotCoverageArea(caPlotter,sensor.SensorLocation,sensor.MaxRange, ...
    sensor.Yaw,sensor.FieldOfView(1))
detPlotter = detectionPlotter(BEplot,'DisplayName','Vision Detections');
detPos = cellfun(@(d)d.Measurement(1:2),dets,'UniformOutput',false);
detPos = cell2mat(detPos')';
if ~isempty(detPos)
    plotDetection(detPlotter,detPos)
end

Create a vision sensor by using a monocular camera configuration, and generate detections from that sensor.
Specify the intrinsic parameters of the camera and create a monoCamera object from these parameters. The camera is mounted on top of an ego vehicle at a height of 1.5 meters above the ground and a pitch of 1 degree toward the ground.
focalLength = [800 800];
principalPoint = [320 240];
imageSize = [480 640];
intrinsics = cameraIntrinsics(focalLength,principalPoint,imageSize);

height = 1.5;
pitch = 1;
monoCamConfig = monoCamera(intrinsics,height,'Pitch',pitch);
Create a vision detection generator using the monocular camera configuration.
visionSensor = visionDetectionGenerator(monoCamConfig);
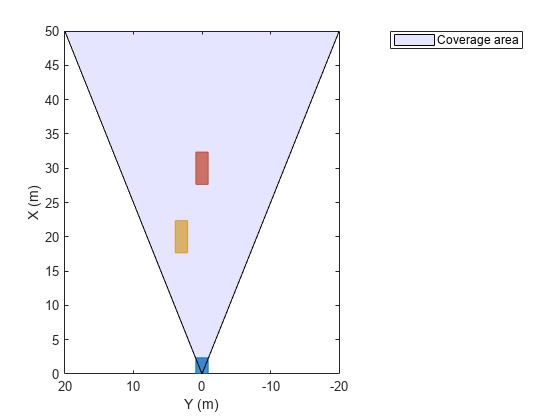
Generate a driving scenario with an ego vehicle and two target cars. Position the first target car 30 meters directly in front of the ego vehicle. Position the second target car 20 meters in front of the ego vehicle but offset to the left by 3 meters.
scenario = drivingScenario;
egoVehicle = vehicle(scenario,'ClassID',1);
targetCar1 = vehicle(scenario,'ClassID',1,'Position',[30 0 0]);
targetCar2 = vehicle(scenario,'ClassID',1,'Position',[20 3 0]);
Use a bird's-eye plot to display the vehicle outlines and sensor coverage area.
figure
bep = birdsEyePlot('XLim',[0 50],'YLim',[-20 20]);

olPlotter = outlinePlotter(bep);
[position,yaw,length,width,originOffset,color] = targetOutlines(egoVehicle);
plotOutline(olPlotter,position,yaw,length,width);

caPlotter = coverageAreaPlotter(bep,'DisplayName','Coverage area','FaceColor','blue');
plotCoverageArea(caPlotter,visionSensor.SensorLocation,visionSensor.MaxRange, ...
    visionSensor.Yaw,visionSensor.FieldOfView(1))
Obtain the poses of the target cars from the perspective of the ego vehicle. Use these poses to generate detections from the sensor.
poses = targetPoses(egoVehicle);
[dets,numValidDets] = visionSensor(poses,scenario.SimulationTime);
Display the (X,Y) positions of the valid detections. For each detection, the (X,Y) positions are the first two values of the Measurement field.
for i = 1:numValidDets
    XY = dets{i}.Measurement(1:2);
    detXY = sprintf('Detection %d: X = %.2f meters, Y = %.2f meters',i,XY);
    disp(detXY)
end
Detection 1: X = 19.09 meters, Y = 2.79 meters
Detection 2: X = 27.81 meters, Y = 0.08 meters
Create a driving scenario containing an ego vehicle and a target vehicle traveling along a three-lane road. Detect the lane boundaries by using a vision detection generator.
scenario = drivingScenario;
Create a three-lane road by using lane specifications.
roadCenters = [0 0 0; 60 0 0; 120 30 0];
lspc = lanespec(3);
road(scenario,roadCenters,'Lanes',lspc);
Specify that the ego vehicle follows the center lane at 30 m/s.
egovehicle = vehicle(scenario,'ClassID',1);
egopath = [1.5 0 0; 60 0 0; 111 25 0];
egospeed = 30;
smoothTrajectory(egovehicle,egopath,egospeed);
Specify that the target vehicle travels ahead of the ego vehicle at 40 m/s and changes lanes close to the ego vehicle.
targetcar = vehicle(scenario,'ClassID',1);
targetpath = [8 2; 60 -3.2; 120 33];
targetspeed = 40;
smoothTrajectory(targetcar,targetpath,targetspeed);
Display a chase plot for a 3-D view of the scenario from behind the ego vehicle.
chasePlot(egovehicle)

Create a vision detection generator that detects lanes and objects. The pitch of the sensor points one degree downward.
visionSensor = visionDetectionGenerator('Pitch',1.0);
visionSensor.DetectorOutput = 'Lanes and objects';
visionSensor.ActorProfiles = actorProfiles(scenario);
Run the simulation.
Create a bird's-eye plot and the associated plotters.
Display the sensor coverage area.
Display the lane markings.
Obtain ground truth poses of targets on the road.
Obtain ideal lane boundary points up to 60 m ahead.
Generate detections from the ideal target poses and lane boundaries.
Display the outline of the target.
Display object detections when the object detection is valid.
Display the lane boundary when the lane detection is valid.
bep = birdsEyePlot('XLim',[0 60],'YLim',[-35 35]);
caPlotter = coverageAreaPlotter(bep,'DisplayName','Coverage area', ...
    'FaceColor','blue');
detPlotter = detectionPlotter(bep,'DisplayName','Object detections');
lmPlotter = laneMarkingPlotter(bep,'DisplayName','Lane markings');
lbPlotter = laneBoundaryPlotter(bep,'DisplayName', ...
    'Lane boundary detections','Color','red');
olPlotter = outlinePlotter(bep);
plotCoverageArea(caPlotter,visionSensor.SensorLocation,...
    visionSensor.MaxRange,visionSensor.Yaw, ...
    visionSensor.FieldOfView(1));
while advance(scenario)
    [lmv,lmf] = laneMarkingVertices(egovehicle);
    plotLaneMarking(lmPlotter,lmv,lmf)
    tgtpose = targetPoses(egovehicle);
    lookaheadDistance = 0:0.5:60;
    lb = laneBoundaries(egovehicle,'XDistance',lookaheadDistance,'LocationType','inner');
    [obdets,nobdets,obValid,lb_dets,nlb_dets,lbValid] = ...
        visionSensor(tgtpose,lb,scenario.SimulationTime);
    [objposition,objyaw,objlength,objwidth,objoriginOffset,color] = targetOutlines(egovehicle);
    plotOutline(olPlotter,objposition,objyaw,objlength,objwidth, ...
        'OriginOffset',objoriginOffset,'Color',color)
    if obValid
        detPos = cellfun(@(d)d.Measurement(1:2),obdets,'UniformOutput',false);
        detPos = vertcat(zeros(0,2),cell2mat(detPos')');
        plotDetection(detPlotter,detPos)
    end
    if lbValid
        plotLaneBoundary(lbPlotter,vertcat(lb_dets.LaneBoundaries))
    end
end


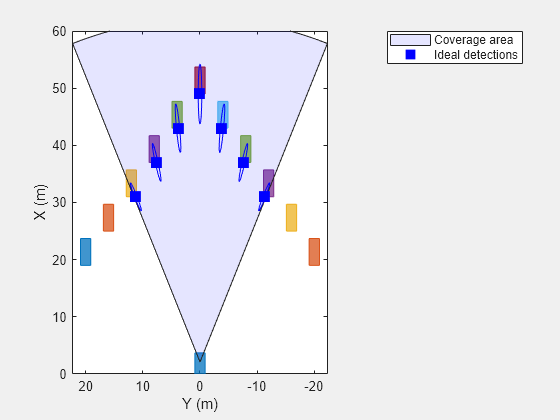
Generate detections from an ideal vision sensor and compare these detections to ones from a noisy sensor. An ideal sensor is one that always generates detections, with no false positives and no added random noise.
Create a Driving Scenario
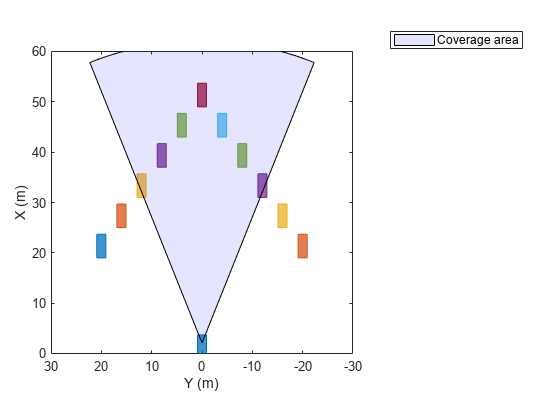
Create a driving scenario in which the ego vehicle is positioned in front of a diagonal array of target cars. With this configuration, you can later plot the measurement noise covariances of the detected targets without having the target cars occlude one another.
scenario = drivingScenario;
egoVehicle = vehicle(scenario,'ClassID',1);

numTgts = 6;
x = linspace(20,50,numTgts)';
y = linspace(-20,0,numTgts)';
x = [x;x(1:end-1)];
y = [y;-y(1:end-1)];
numTgts = numel(x);

for m = 1:numTgts
    vehicle(scenario,'ClassID',1,'Position',[x(m) y(m) 0]);
end
Plot the driving scenario in a bird's-eye plot.
bep = birdsEyePlot('XLim',[0 60]);
legend('hide')

olPlotter = outlinePlotter(bep);
[position,yaw,length,width,originOffset,color] = targetOutlines(egoVehicle);
plotOutline(olPlotter,position,yaw,length,width, ...
    'OriginOffset',originOffset,'Color',color)
Create an Ideal Vision Sensor
Create a vision sensor by using the visionDetectionGenerator System object™. To generate ideal detections, set DetectionProbability to 1, FalsePositivesPerImage to 0, and HasNoise to false.
DetectionProbability = 1— The sensor always generates detections for a target, as long as the target is not occluded and meets the range, speed, and image size constraints.FalsePositivesPerImage = 0— The sensor generates detections from only real targets in the driving scenario.HasNoise = false— The sensor does not add random noise to the reported position and velocity of the target. However, theobjectDetectionobjects returned by the sensor have measurement noise values set to the noise variance that would have been added ifHasNoiseweretrue. With these noise values, you can process ideal detections using themultiObjectTracker. This technique is useful for analyzing maneuver lag without needing to run time-consuming Monte Carlo simulations.
idealSensor = visionDetectionGenerator( ...
    'SensorIndex',1, ...
    'UpdateInterval',scenario.SampleTime, ...
    'SensorLocation',[0.75*egoVehicle.Wheelbase 0], ...
    'Height',1.1, ...
    'Pitch',0, ...
    'Intrinsics',cameraIntrinsics(800,[320 240],[480 640]), ...
    'BoundingBoxAccuracy',50, ... % Make the noise large for illustrative purposes
    'ProcessNoiseIntensity',5, ...
    'MaxRange',60, ...
    'DetectionProbability',1, ...
    'FalsePositivesPerImage',0, ...
    'HasNoise',false, ...
    'ActorProfiles',actorProfiles(scenario))
idealSensor =
  visionDetectionGenerator with properties:

               SensorIndex: 1
            UpdateInterval: 0.0100

            SensorLocation: [2.1000 0]
                    Height: 1.1000
                       Yaw: 0
                     Pitch: 0
                      Roll: 0
                Intrinsics: [1×1 cameraIntrinsics]

            DetectorOutput: 'Objects only'
               FieldOfView: [43.6028 33.3985]
                  MaxRange: 60
                  MaxSpeed: 100
       MaxAllowedOcclusion: 0.5000
        MinObjectImageSize: [15 15]

      DetectionProbability: 1
    FalsePositivesPerImage: 0

  Show all properties
Plot the coverage area of the ideal vision sensor.
legend('show')
caPlotter = coverageAreaPlotter(bep,'DisplayName','Coverage area','FaceColor','blue');
mountPosition = idealSensor.SensorLocation;
range = idealSensor.MaxRange;
orientation = idealSensor.Yaw;
fieldOfView = idealSensor.FieldOfView(1);
plotCoverageArea(caPlotter,mountPosition,range,orientation,fieldOfView);
Simulate Ideal Vision Detections
Obtain the positions of the targets. The positions are in ego vehicle coordinates.
gTruth = targetPoses(egoVehicle);
Generate timestamped vision detections. These detections are returned as a cell array of objectDetection objects.
time = scenario.SimulationTime;
dets = idealSensor(gTruth,time);
Inspect the measurement and measurement noise variance of the first (leftmost) detection. Even though the detection is ideal and therefore has no added random noise, the MeasurementNoise property shows the values as if the detection did have noise.
dets{1}.Measurementans = 6×1
31.0000
-11.2237
0
0
0
0
dets{1}.MeasurementNoiseans = 6×6
1.5427 -0.5958 0 0 0 0
-0.5958 0.2422 0 0 0 0
0 0 100.0000 0 0 0
0 0 0 0.5398 -0.1675 0
0 0 0 -0.1675 0.1741 0
0 0 0 0 0 100.0000
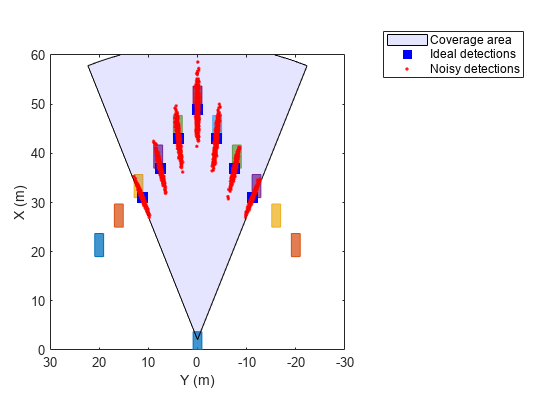
Plot the ideal detections and ellipses for the 2-sigma contour of the measurement noise covariance.
pos = cell2mat(cellfun(@(d)d.Measurement(1:2)',dets, ...
    'UniformOutput',false));
cov = reshape(cell2mat(cellfun(@(d)d.MeasurementNoise(1:2,1:2),dets, ...
    'UniformOutput',false))',2,2,[]);
plotter = trackPlotter(bep,'DisplayName','Ideal detections', ...
    'MarkerEdgeColor','blue','MarkerFaceColor','blue');
sigma = 2;
plotTrack(plotter,pos,sigma^2*cov)
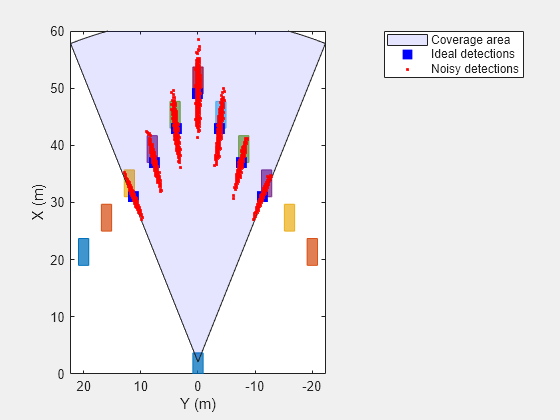
Simulate Noisy Detections for Comparison
Create a noisy sensor based on the properties of the ideal sensor.
noisySensor = clone(idealSensor);
release(noisySensor)
noisySensor.HasNoise = true;
Reset the driving scenario back to its original state.
restart(scenario)
Collect statistics from the noisy detections.
numMonte = 1e3;
pos = [];
for itr = 1:numMonte
    time = scenario.SimulationTime;
    dets = noisySensor(gTruth,time);

    % Save noisy measurements
    pos = [pos;cell2mat(cellfun(@(d)d.Measurement(1:2)',dets,'UniformOutput',false))];

    advance(scenario);
end
Plot the noisy detections.
plotter = detectionPlotter(bep,'DisplayName','Noisy detections', ...
    'Marker','.','MarkerEdgeColor','red','MarkerFaceColor','red');
plotDetection(plotter,pos)
Algorithms
The vision sensor models a monocular camera that produces 2-D camera images. To project the coordinates of these 2-D images into the 3-D world coordinates used in driving scenarios, the sensor algorithm assumes that the z-position (height) of all image points of the bottom edge of the target’s image bounding box lie on the ground. The plane defining the ground is defined by the height property of the vision detection generator, which defines the offset of the monocular camera above the ground plane. With this projection, the vertical locations of objects in the produced images are strongly correlated to their heights above the road. However, if the road is not flat and the heights of objects differ from the height of the sensor, then the sensor reports inaccurate detections. For an example that shows this behavior, see Model Vision Sensor Detections.
Extended Capabilities
Version History
Introduced in R2017a
See Also
Objects
lidarPointCloudGenerator|objectDetection|drivingScenario|laneMarking|lanespec|monoCamera|multiObjectTracker|drivingRadarDataGenerator|insSensor