clothoidLaneBoundary
Clothoid-shaped lane boundary model
Description
A clothoidLaneBoundary object contains
information about a clothoid-shaped lane boundary model. A
clothoid is a type of curve whose rate of change of curvature
varies linearly with distance.
Creation
Description
bdry = clothoidLaneBoundarybdry with default property
values.
bdry = clothoidLaneBoundary(Name,Value)clothoidLaneBoundary('BoundaryType','Solid') creates a
clothoid lane boundary model with solid lane boundaries. Enclose each property
name in quotes.
Properties
Lane boundary curvature, specified as a real scalar. This property represents the rate of change of lane boundary direction with respect to distance. Units are in degrees per meter.
Example: -1.0
Data Types: single | double
Derivative of lane boundary curvature, specified as a real scalar. This property represents the rate of change of lane curvature with respect to distance. Units are in degrees per meter squared.
Example: -0.01
Data Types: single | double
Length of the lane boundary along the road, specified as a nonnegative real scalar. Units are in meters.
Example: 25
Data Types: single | double
Initial lane boundary heading, specified as a real scalar. The heading angle of the lane boundary is relative to the heading of the ego vehicle. Units are in degrees.
Example: 10
Data Types: single | double
Lateral offset of the ego vehicle position from the lane boundary, specified as a real scalar. An offset to a lane boundary to the left of the ego vehicle is positive. An offset to the right of the ego vehicle is negative. Units are in meters. In this image, the ego vehicle is offset 1.5 meters from the left lane and 2.1 meters from the right lane.
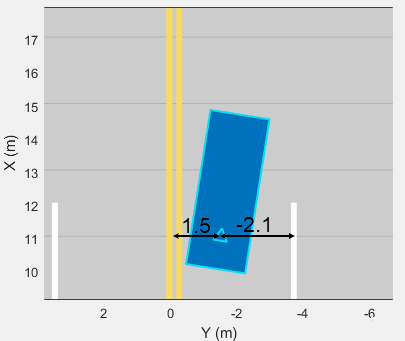
Example: -1.2
Data Types: single | double
Type of lane boundary marking, specified as one of these values.
'Unmarked' | 'Solid' | 'Dashed' | 'DoubleSolid' | 'DoubleDashed' | 'SolidDashed' | 'DashedSolid' |
|---|---|---|---|---|---|---|
No lane marking | Solid line | Dashed line | Two solid lines | Two dashed lines | Solid line on left, dashed line on right | Dashed line on left, solid line on right |
|
|
|
|
|
|
|
|


Visibility of lane marking, specified as a real scalar in the range [0,
1]. A value of 0 corresponds to a marking that is not
visible. A value of 1 corresponds to a marking that is
completely visible. For a double lane marking, the same strength is used for
both lines.
Example: 0.9
Data Types: single | double
Extent of the lane boundary marking along the X-axis, specified as a real-valued vector of the form [Xmin Xmax]. Units are in meters. The X-axis runs vertically and is positive in the forward direction of the ego vehicle.
Example: [0 100]
Data Types: single | double
Width of lane boundary marking, specified as a nonnegative real scalar. For a double lane marking, this value applies to the width of each lane marking and to the distance between those markings. Units are in meters.
Example: 0.15
Data Types: single | double
Object Functions
computeBoundaryModel | Compute lane boundary points from clothoid lane boundary model |
Examples
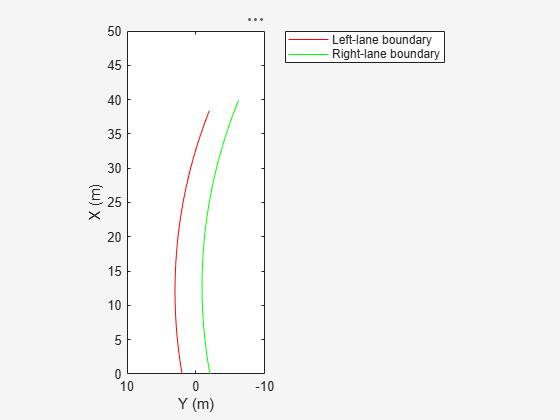
Create clothoid curves to represent left and right lane boundaries. Then, plot the curves.
Create the left boundary.
lb = clothoidLaneBoundary('BoundaryType','Solid', ...
'Strength',1,'Width',0.2,'CurveLength',40, ...
'Curvature',-0.8,'LateralOffset',2,'HeadingAngle',10);
Create the right boundary with almost identical properties.
rb = lb;
rb.LateralOffset = -2;
Create a bird's-eye plot. Then, create the lane boundary plotters and plot the boundaries.
bep = birdsEyePlot('XLimits',[0 50],'YLimits',[-10 10]);
lbPlotter = laneBoundaryPlotter(bep,'DisplayName','Left-lane boundary','Color','r');
rbPlotter = laneBoundaryPlotter(bep,'DisplayName','Right-lane boundary','Color','g');
plotLaneBoundary(lbPlotter,lb)
plotLaneBoundary(rbPlotter,rb);
grid
hold on
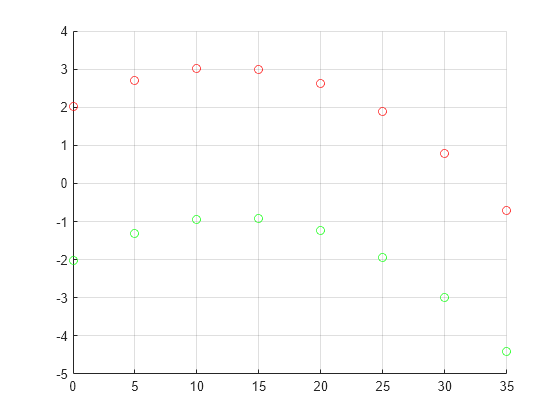
Plot the coordinates of selected points along the boundaries.
x = 0:5:50;
yl = computeBoundaryModel(lb,x);
yr = computeBoundaryModel(rb,x);
plot(x,yl,'ro')
plot(x,yr,'go')
hold off
Version History
Introduced in R2018a