SIFTPoints
Description
The SIFTPoints object enables you to pass data between the
detectSIFTFeatures and extractFeatures functions. You can also use it to manipulate and plot the data
returned by these functions. You can use the object to fill interest points
interactively.
Creation
Description
Input Arguments
Properties
Object Functions
plot | Plot detected feature points |
isempty | Determine if points object is empty |
length | Number of stored points |
selectStrongest | Select points with strongest metrics |
size | Return size of points object |
selectUniform | Select uniformly distributed subset of point features |
select | Select point or region features during code generation |
Examples
Read an image.
I = imread("cameraman.tif");Detect SIFT features in the image.
points = detectSIFTFeatures(I)
points =
  245×1 SIFTPoints array with properties:

          Scale: [245×1 single]
    Orientation: [245×1 single]
         Octave: [245×1 int32]
          Layer: [245×1 int32]
       Location: [245×2 single]
         Metric: [245×1 single]
          Count: 245
Display the location and scale of the 10 strongest points in the image.
strongest = points.selectStrongest(10);
imshow(I)
hold on
plot(strongest) 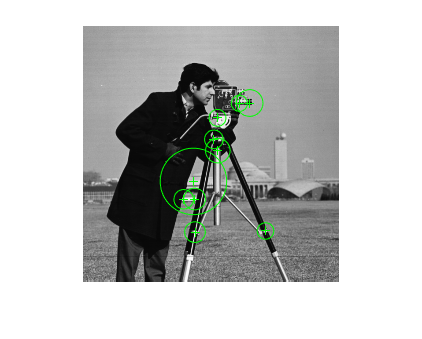
Display the [x y] coordinates for the selected points.
strongest.Location
ans = 10×2 single matrix

  183.0139  205.4790
  112.5054  206.6145
  135.2954  125.0968
  101.1768  173.8070
  131.3702  113.8461
  167.1152   77.5036
  110.9539  155.9264
  135.0020   92.3701
  112.1106  173.5276
  156.8862   77.8692
Read an image into the workspace.
I = imread("cameraman.tif");Detect SIFT features in the image.
points = detectSIFTFeatures(I);
Display the last 5 detected points.
imshow(I)
hold on
plot(points(end-4:end))
Tips
Although
SIFTPointsmay hold many points, it is a scalar object. Therefore,numel(SIFTPoints) always returns1. This value may differ fromlength(SIFTPoints), which returns the true number of points held by the object.Properties can be specified as a scalar or a vector whose length matches the number of coordinates in
location.
References
[1] Lowe, David G.. "Distinctive Image Features from Scale-Invariant Keypoints." Int. J. Comput. Vision 60 , no. 2 (2004): 91--110.
Extended Capabilities
Version History
Introduced in R2021b