Cluster Data
Cluster data using k-means or hierarchical clustering in the Live Editor
Since R2021b
Description
The Cluster Data Live Editor Task enables you to interactively perform k-means or hierarchical clustering. The task generates MATLAB® code for your live script and returns the resulting cluster indices to the MATLAB workspace. If you perform k-means clustering, the task also returns the cluster centroid locations.
You can:
Specify the number of clusters manually. For hierarchical clustering, you can specify the cutoff for the underlying hierarchical cluster tree.
Determine the optimal number of clusters for your data automatically by specifying criteria such as gap values, silhouette values, Davies-Bouldin index values, and Calinski-Harabasz index values.
Customize the parameters for clustering your data, such as the distance metric to use.
Automatically visualize the clustered data.
For general information about Live Editor tasks, see Add Interactive Tasks to a Live Script.

Open the Task
To add the Cluster Data task to a live script:
On the Live Editor tab, select Task > Cluster Data.
In a code block in the live script, type a relevant keyword, such as
clustering,kmeans, orhierarchical. Select Cluster Data from the suggested command completions.
Examples
This example shows how to use the Cluster Data task to interactively perform k-means clustering for a specified number of clusters.
Load the sample data. The data contains length and width measurements from the sepals and petals of three species of iris flowers.
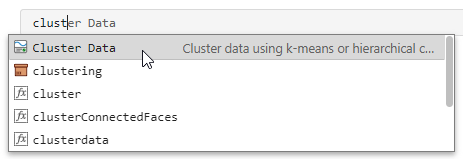
load fisheririsOpen the Cluster Data task. To open the task, begin
typing the keyword clustering in a code block and select
Cluster Data from the suggested command completions.
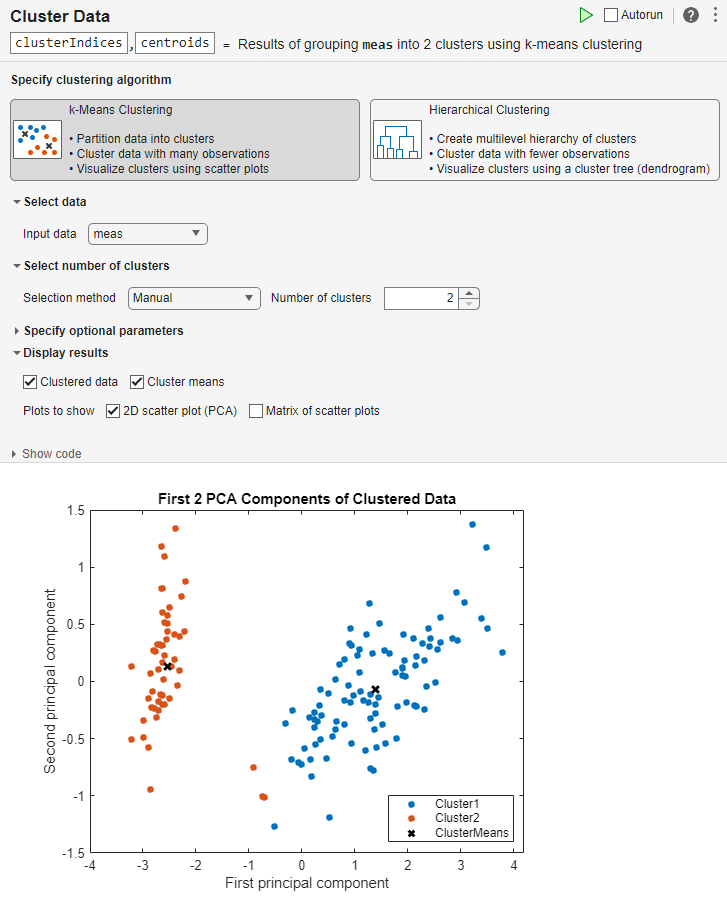
In the task, select the k-Means Clustering algorithm. (since R2024a)
Cluster the data into two clusters.
Select the
measvariable as the input data.Set the number of clusters to
2, if necessary.In the Live Editor tab, click the
 Run button to run the task.
MATLAB displays the clustered data and the cluster means in a scatter plot.
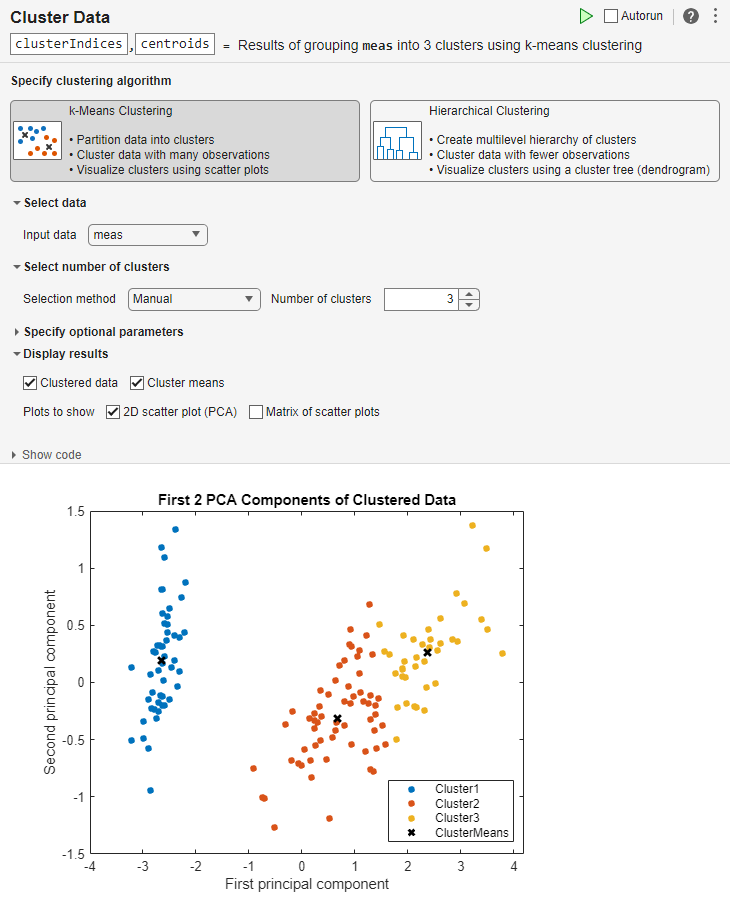
Increase the number of clusters to 3 and rerun the task.
MATLAB displays the updated clustered data and the cluster means in a scatter
plot.
The task generates code in your live script. The generated code reflects the parameters and options that you select, and includes code to generate the scatter plot. To see the generated code, click Show code at the bottom of the task parameter area. The task expands to display the generated code.
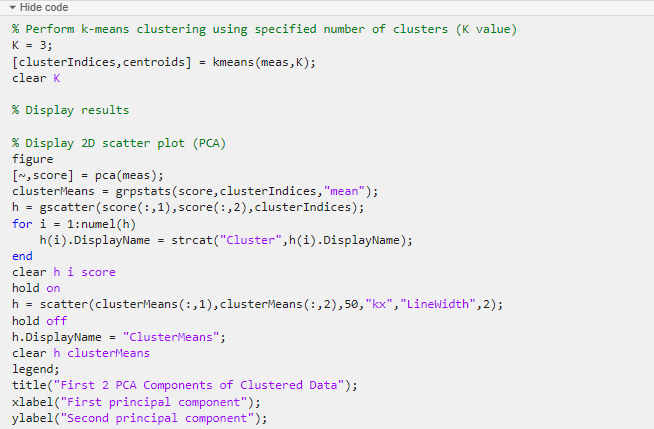
By default, the generated code uses clusterIndices and
centroids as the name of the output variables returned to the
MATLAB workspace. The clusterIndices vector is a numeric
column vector containing the cluster indices. Each row in
clusterIndices indicates the cluster assignment of the
corresponding observation. The centroids matrix is a numeric matrix
containing the cluster centroid locations. To specify a different output variable name,
enter a new name in the summary line at the top of the task. For instance, change the
two variable names to c_indices and
c_locations.

When the task runs, the generated code is updated to reflect the new variable names.
The new variables c_indices and c_locations appear
in the MATLAB workspace.
This example shows how to use the Cluster Data task to interactively evaluate clustering solutions based on selected criteria.
Load the sample data. The data contains length and width measurements from the sepals and petals of three species of iris flowers.
load fisheririsOpen the Cluster Data task. To open the task, begin
typing the keyword clustering in a code block and select
Cluster Data from the suggested command completions.

In the task, select the k-Means Clustering algorithm. (since R2024a)
Evaluate the optimal number of clusters.
Select the
measvariable as the input data.Set the number of clusters selection method to
Optimal.Set the range min and max to
2and6.In the Live Editor tab, click the
 Run button to run the task.

MATLAB displays a bar chart with evaluation results, indicating that, based on the Calinski-Harabasz criterion, the optimal number of clusters is 3. A scatter plot shows the clustered data and the cluster means using the optimal number of clusters, 3. Your results might differ.

Since R2024a
This example shows how to use the Cluster Data task to interactively perform hierarchical clustering for a specified cluster tree cutoff.
Load the sample data. The data contains length and width measurements from the sepals and petals of three species of iris flowers.
load fisheririsOpen the Cluster Data task. To open the task, begin
typing the keyword clustering in a code block and select
Cluster Data from the suggested command completions.

In the task, select the Hierarchical Clustering algorithm.
Cluster the data using the default number of clusters.
Select the
measvariable as the input data.Set the maximum number of clusters to
2, if necessary.In the Live Editor tab, click the
 Run button to run the task.
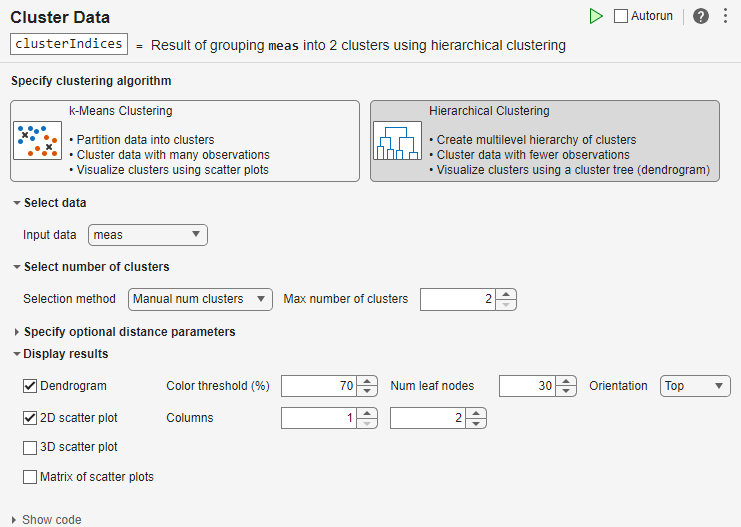
MATLAB displays the cluster tree in a dendrogram and the clustered data in a scatter plot.
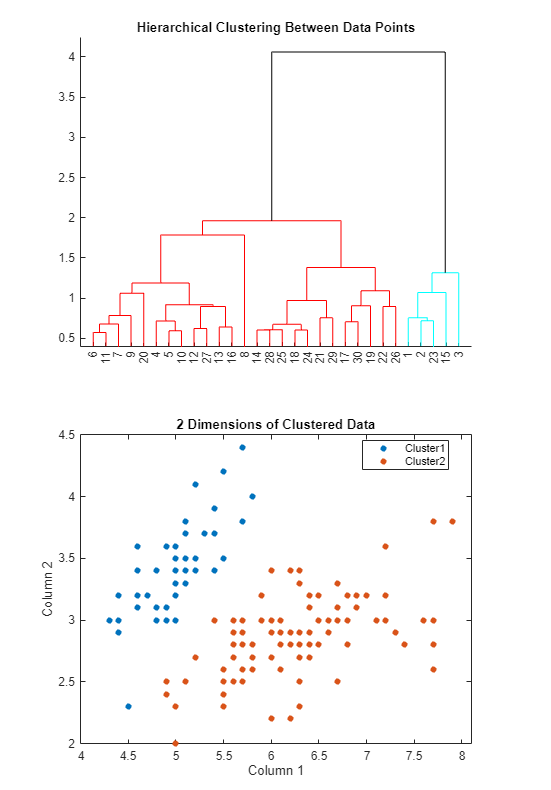
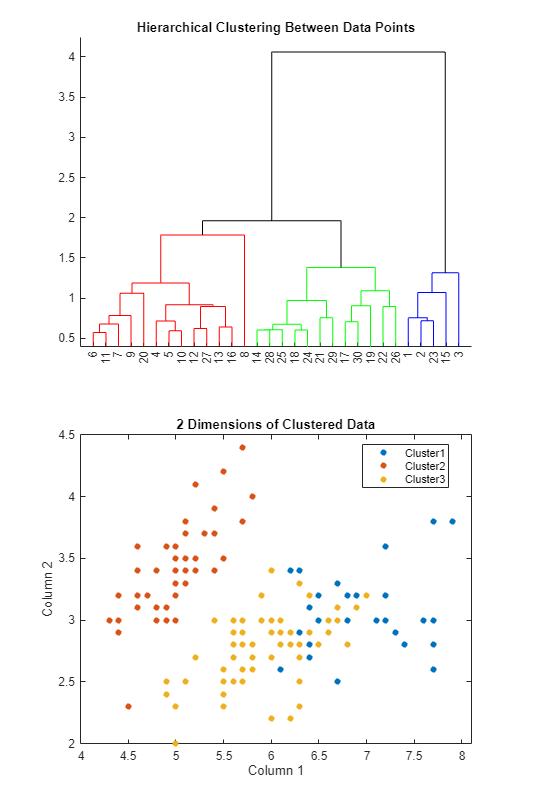
Use a cutoff to split the data into three clusters and rerun the task.
Set the selection method for the number of clusters to
Manual cutoff.Set the threshold to
1.8and the cluster criterion toDistance. The previous dendrogram shows that this cutoff value splits the hierarchical cluster tree into three clusters.In the Live Editor tab, click the
 Run button to run the task.

MATLAB displays the updated dendrogram and scatter plot.
The task generates code in your live script. The generated code reflects the parameters and options that you select, and includes code to generate the scatter plot. To see the generated code, click Show code at the bottom of the task parameter area. The task expands to display the generated code.
By default, the generated code uses clusterIndices as the name of
the output variable returned to the MATLAB workspace. The clusterIndices vector is a numeric
column vector containing the cluster indices. Each row in
clusterIndices indicates the cluster assignment of the
corresponding observation. To specify a different output variable name, enter a new name
in the summary line at the top of the task. For instance, change the variable name to
c_indices.
When the task runs, the generated code is updated to reflect the new variable name.
The new variable c_indices appears in the MATLAB workspace.
Related Examples
Parameters
Specify the data to cluster by selecting a variable from the available workspace variables. The variable must be a numeric matrix to appear in the list.
Specify the method for determining the optimal number of clusters for your data.
k-Means Clustering Options
Manual(default) — Specify the number of clusters to group your data into manually.Optimal— Use theevalclustersfunction to find the optimal number of clusters based on criteria such as gap values, silhouette values, Davies-Bouldin index values, and Calinski-Harabasz index values.
Hierarchical Clustering Options
Manual num clusters(default) — Specify the maximum number of clusters to group your data into manually.Manual cutoff— Specify the threshold for cutting the hierarchical cluster tree and determining the number of clusters to group your data into manually. If you use theInconsistencycriterion, then the Cluster Data task groups clusters whose subclusters have inconsistency coefficients less than the threshold. If you use theDistancecriterion, then the Cluster Data task groups clusters whose subclusters have a height less than the threshold.Optimal num clusters— Use theevalclustersfunction to find the optimal number of clusters based on criteria such as gap values, silhouette values, Davies-Bouldin index values, and Calinski-Harabasz index values.
Specify the list of number of clusters to evaluate as a range consisting of a min
value and a max value. For example, if you specify a min value of 2
and a max value of 6, the task evaluates the number of clusters 2, 3,
4, 5, and 6 to determine the optimal number.
For k-means clustering, the default range is
2:5. For hierarchical clustering, the default range is
2:3.
To display the clustered data, select from the available options.
k-Means Clustering Options
Select 2D scatter plot (PCA) to display the principal components of the clustered data in a 2D scatter plot. The Cluster Data task uses the
pcaandgscatterfunctions to create the scatter plot.Select Matrix of scatter plots to display the clustered data in a matrix of scatter plots. When you select Matrix of scatter plots, a list appears to the right of the check box. Each item in the list represents a column in the specified input data. Press the Ctrl key and select a maximum of four input data columns from the list. The Cluster Data task uses the
gplotmatrixfunction to create the matrix of scatter plots from the selected columns.The scatter plots in the matrix compare the selected input data columns across cluster indices. The diagonal plots in the matrix are histograms showing the distribution of the selected columns for each cluster indices.
For both plots, you can choose whether to display the clustered data and the cluster means.
Hierarchical Clustering Options
Select Dendrogram to display the hierarchical cluster tree. When you select Dendrogram, several parameters appear to the right of the check box:
Color method: Select Cluster indices to color groups of nodes in the dendrogram according to the cluster assignments. When you select None, all of the nodes in the dendrogram have the same color. Select Color threshold (%) to specify the threshold for unique colors in the dendrogram as a percentage of the maximum (linkage) distance in the tree.
Num leaf nodes: Specify the maximum number of leaf nodes to display in the dendrogram.
Orientation: Specify the location of the dendrogram root node.
TopandBottomcorrespond to a vertical dendrogram, where the leaf nodes are arranged horizontally.LeftandRightcorrespond to a horizontal dendrogram, where the leaf nodes are arranged vertically.Optimal leaf order: Arrange the nodes in optimal leaf order. The optimal leaf order for a binary tree maximizes the sum of the similarities between adjacent leaves by flipping tree branches without dividing the clusters.
Show markers: Show the leaf node markers on the dendrogram. Click a marker to display information about the row numbers (and cluster assignments, when applicable) for the leaf node.
Show cut: Display a dashed line that shows where the tree is cut to produce each colored leaf node assignment.
The Cluster Data task uses the
dendrogramfunction to create the plot. The dendrogram is not available when you use theOptimal num clustersselection method.Select 2D scatter plot to display the clustered data in a 2D scatter plot. When you select 2D scatter plot, two lists appear to the right of the check box. The items in the lists represent columns in the specified input data. The first list determines the x-axis variable in the plot, and the second list determines the y-axis variable. The Cluster Data task uses the
gscatterfunction to create the scatter plot.Instead of selecting 2D scatter plot, you can select 3D scatter plot to display the clustered data in a 3D scatter plot. When you select 3D scatter plot, three lists appear to the right of the check box. The lists determine the x-axis, y-axis, and z-axis variables. The Cluster Data task uses the
scatter3function to create the scatter plot.Select Matrix of scatter plots to display the clustered data in a matrix of scatter plots. When you select Matrix of scatter plots, a list appears to the right of the check box. Each item in the list represents a column in the specified input data. Press the Ctrl key and select a maximum of four input data columns from the list. The Cluster Data task uses the
gplotmatrixfunction to create the matrix of scatter plots from the selected columns.
Tips
By default, the Cluster Data task does not automatically run when you modify the task parameters. To have the task run automatically after any change, select the Autorun box at the top right of the task. If your data set is large, do not enable this option.
Version History
Introduced in R2021bWhen you perform hierarchical clustering in the Cluster Data Live Editor Task, you can:
Color a dendrogram plot according to cluster assignments.
Arrange dendrogram nodes in optimal leaf order. The optimal leaf order for a binary tree maximizes the sum of the similarities between adjacent leaves by flipping tree branches without dividing the clusters.
Display a dashed line that shows where the tree is cut to produce each colored leaf node assignment in a dendrogram plot.
Show a marker for each leaf node. Click a marker to display information about the row numbers (and cluster assignments, when applicable) for the leaf node.
You can use the Cluster Data Live Editor Task to interactively perform hierarchical clustering in a live script.
Select the maximum number of clusters, or specify an appropriate cutoff for the underlying hierarchical cluster tree (dendrogram). Optionally, specify the metric for computing the distance between observations and the method for computing the distance between clusters. The task plots the dendrogram, allowing you to interactively explore the effects of changing parameter values and options.
Alternatively, evaluate the optimal number of clusters. You can optionally specify the criterion for defining clusters in the hierarchical cluster tree. In this case, the task does not plot the dendrogram. Use scatter plots to visualize the clusters.
The task automatically generates code that becomes part of your live script.
See Also
kmeans | evalclusters | scatter | gscatter | gplotmatrix | pca | pdist | linkage | cluster | dendrogram | scatter3
MATLAB Command
You clicked a link that corresponds to this MATLAB command:
Run the command by entering it in the MATLAB Command Window. Web browsers do not support MATLAB commands.
Select a Web Site
Choose a web site to get translated content where available and see local events and offers. Based on your location, we recommend that you select: .
You can also select a web site from the following list
How to Get Best Site Performance
Select the China site (in Chinese or English) for best site performance. Other MathWorks country sites are not optimized for visits from your location.
Americas
- América Latina (Español)
- Canada (English)
- United States (English)
Europe
- Belgium (English)
- Denmark (English)
- Deutschland (Deutsch)
- España (Español)
- Finland (English)
- France (Français)
- Ireland (English)
- Italia (Italiano)
- Luxembourg (English)
- Netherlands (English)
- Norway (English)
- Österreich (Deutsch)
- Portugal (English)
- Sweden (English)
- Switzerland
- United Kingdom (English)