Measure Signals
In the Signal Analyzer app, you can measure data, statistics, and peaks for a plotted signal. On the Measurements tab, calculate the values for the minimum, maximum, mean, median, peak-to-peak amplitude, root-mean-square value, and peaks of each signal. You can calculate statistics and find peaks for the entire signal or within a region of interest. The app recalculates values as you zoom, pan, and modify time or cursor limits on the display.
Use Cursors to Measure Signal Data
Interactively measure signal data in the time domain, frequency domain, or time-frequency domain using cursors.
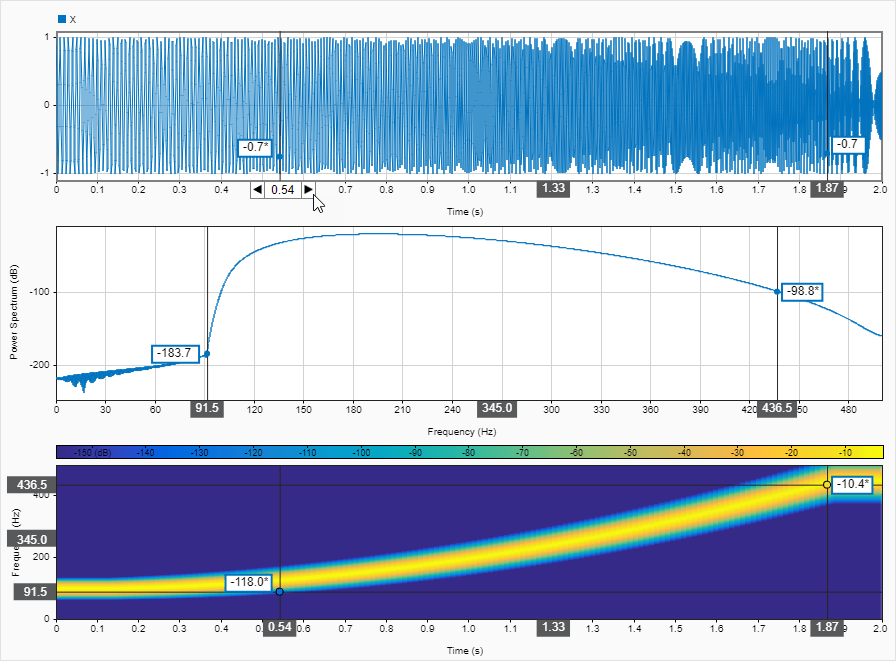
On the Display or Measurements tab, click Data Cursors to add one or two cursors to all views in the selected display. The persistence spectrum, spectrogram, and scalogram views display two-dimensional crosshair cursors.
Note
Cursors measure data at a specific time, frequency, or power value.
Time cursors within a display are linked between views that have a time axis, such as the time, spectrogram, and scalogram views.
Frequency cursors within a display are linked between views that have a frequency axis, such as the spectrum, persistence spectrum, spectrogram, and scalogram views.
Time and frequency cursors are not linked and move independently.
Power cursors appear in views that have a power axis, such as the persistence spectrum view, and move independently of the time and frequency cursors.
To move a data cursor, you can:
Click and drag a cursor left, right, up, or down to a point of interest.
Click the time or frequency field and enter a value.
Click the time or frequency field and use the arrow keys.
If the signal was not sampled at a point of interest, the app linearly interpolates the value and displays an asterisk (*) on the data cursor label. By default, cursors snap to the nearest sampled data point. To change this behavior, on the Display tab, clear the Snap to Data check box.
To toggle the cursors, click Data Cursors.
Calculate Signal Statistics
Measure statistics in the time domain for an entire signal, for the signal region defined by time limits, or within a region of interest specified by cursor limits. This table shows the statistics that the app calculates within a region of interest between two data cursors for three signals.

On the Measurements tab, click Data Cursors to add one or two cursors to all the views in the display. By default, the app calculates statistics based on the current time limits. To measure statistics for the entire signal, click Fit to View in the toolstrip or context menu, or press the spacebar on your keyboard to set the time or sample limits to the limits of the plotted signal. To measure statistics within a region of interest, zoom or pan into a signal region, or add two cursors and click Between Cursors.
Click Signal Statistics ▼ to view the available time statistics. Select the check box next to the statistic(s) you want the app to calculate. By default, the app calculates the minimum, maximum, and mean values for each plotted signal.
Toggle Signal Statistics to calculate the selected statistics and display the results in the measurements table. The app displays a cursor symbol in the ROI header when you calculate statistics for a region of interest between two cursors.
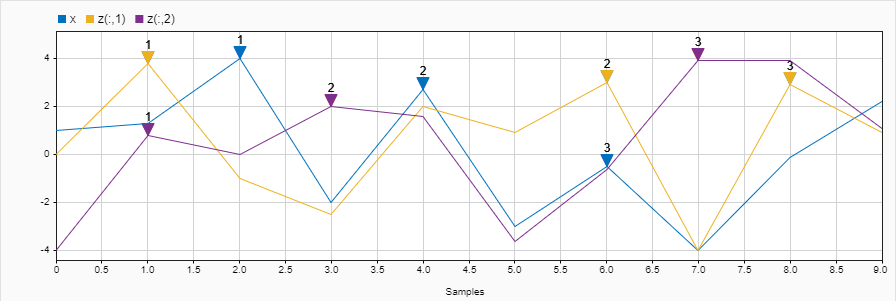
Find and Annotate Signal Peaks
Measure signal peaks in the time domain for the entire signal, for the signal region defined by time limits, or within a region of interest specified by cursor limits. This display shows annotated peaks for three entire signals.
On the Measurements tab, click Data Cursors to add one or two cursors to all the views in the display. By default, the app finds peaks across the current time limits. To find peaks across the entire signal, click Fit to View in the toolstrip or context menu, or press the spacebar on your keyboard to set the time or sample limits to the limits of the plotted signal. To measure peaks within a region of interest, zoom or pan into a signal region, or add two cursors and click Between Cursors.
Toggle Peaks to measure signal peaks with the
Find Peaksoption. To annotate the measured peaks on the time plot, click Peaks ▼ and selectLabel Peaks.To adjust the settings used by the app to find signal peaks, click Peaks ▼ and select
Peaks
                            Settings
. You can specify:Number of Peaks — Number of peaks to find. The default value is
3.Minimum Height — Minimum peak height. The app returns only peaks with height above this value. The default value is
–Inf.Minimum Distance — Minimum distance between peaks. The default value is
0. For more information, see MinPeakDistance.Threshold — Minimum height difference between a peak and its neighbor points. The default value is
0.