Main Content

claimsPlot

Plot claims for development triangle

Since R2021a

Description

example

claimsPlot(dT) plots one line for each origin period for all development periods.

example

claimsPlot(dT,Name,Value) specifies options using one or more name-value pair arguments in addition to the input arguments in the previous syntax.

example

h = claimsPlot(ax,___) additionally returns the figure handle h. Use this syntax with any of the input arguments in previous syntaxes.

Examples

collapse all

Generate a line plot of cumulative claims for each of the development periods using a developmentTriangle object containing simulated insurance claims data.

load InsuranceClaimsData.mat;
head(data)
    OriginYear    DevelopmentYear    ReportedClaims    PaidClaims
    __________    _______________    ______________    __________

       2010             12               3995.7          1893.9  
       2010             24                 4635          3371.2  
       2010             36               4866.8          4079.1  
       2010             48               4964.1            4487  
       2010             60               5013.7          4711.4  
       2010             72               5038.8          4805.6  
       2010             84                 5059          4853.7  
       2010             96               5074.1          4877.9  

Use developmentTriangle to convert the data to a development triangle, which is the standard form for representing claims data.

dT = developmentTriangle(data)
dT = 
  developmentTriangle with properties:

                          Origin: {10x1 cell}
                     Development: {10x1 cell}
                          Claims: [10x10 double]
                  LatestDiagonal: [10x1 double]
                     Description: ""
                      TailFactor: 1
    CumulativeDevelopmentFactors: [1.3069 1.1107 1.0516 1.0261 1.0152 1.0098 1.0060 1.0030 1.0010 1]
               SelectedLinkRatio: [1.1767 1.0563 1.0249 1.0107 1.0054 1.0038 1.0030 1.0020 1.0010]

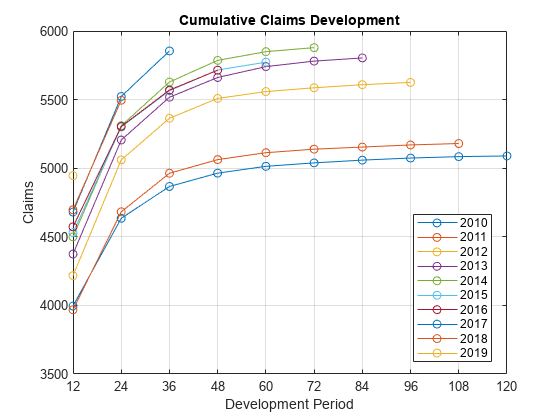
Use the claimsPlot function to generate a line plot of cumulative claims.

claimsPlot(dT)

Input Arguments

collapse all

Development triangle, specified as a previously created developmentTriangle object.

Data Types: object

(Optional) Valid axis object, specified as an ax object created using axes. The function creates the plot on the axes specified by the optional ax argument instead of on the current axes (gca). The optional argument ax must precede any of the input argument combinations.

Data Types: object

Name-Value Arguments

Specify optional pairs of arguments as Name1=Value1,...,NameN=ValueN, where Name is the argument name and Value is the corresponding value. Name-value arguments must appear after other arguments, but the order of the pairs does not matter.

Before R2021a, use commas to separate each name and value, and enclose Name in quotes.

Example: claimsPlot(dT,'Cumulative',false)

Cumulative claims, specified as the comma-separated pair consisting of 'Cumulative' and a logical value.

Data Types: logical

Output Arguments

collapse all

Figure handle for line objects, returned as a handle object.

Version History

Introduced in R2021a