rlDataViewer
Description
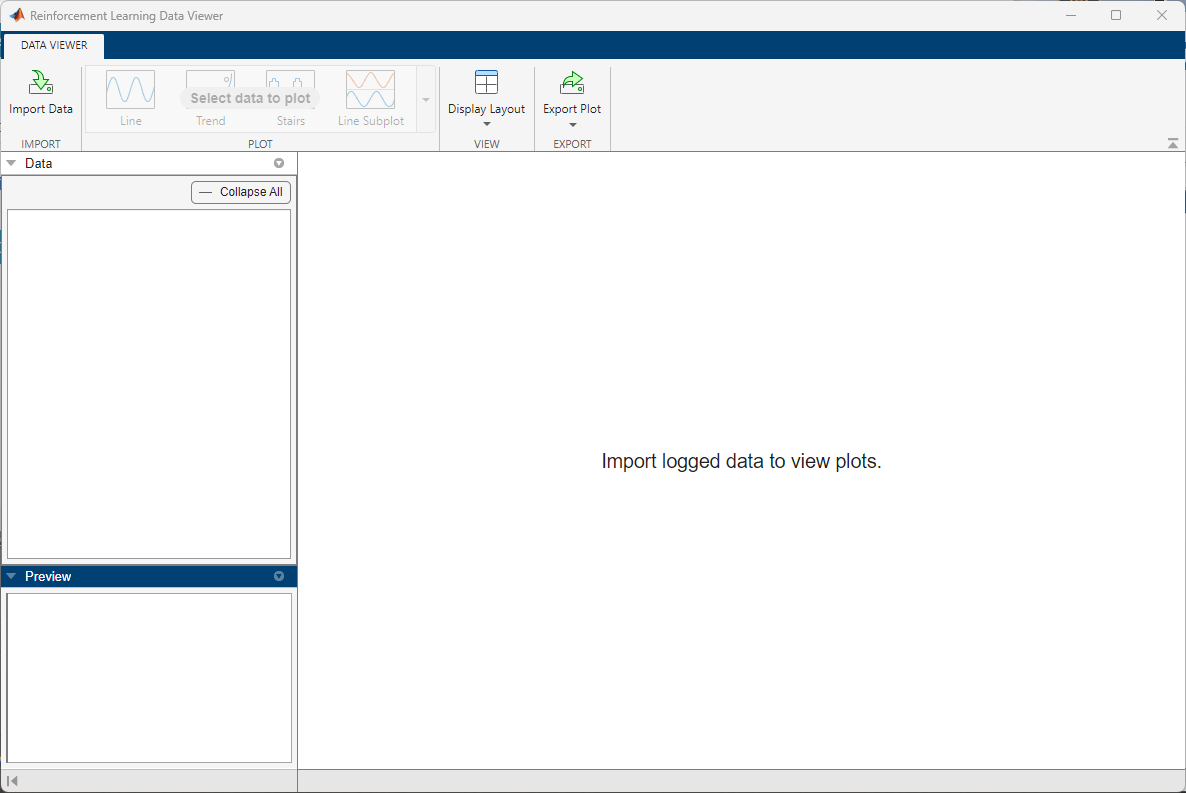
rlDataViewer( opens the
Reinforcement Learning Data Viewer tool to visualize data logged using the
fileLgr)FileLogger object
fileLgr.
Examples
This example shows how to visualize data logged during custom training loop using the Reinforcement Learning Data Viewer.
Create a FileLogger object using rlDataLogger.
flgr = rlDataLogger();
Open a Reinforcement Learning Data Viewer window using rlDataViewer.
rlDataViewer(flgr);
Initialize the logger object.
setup(flgr);
Within a custom training loop, store data to the logger object memory and write data to MAT files. For this example, store a random scalar, a random 2-by-1 vector, and a random 5-by-5 matrix as variables named RandomScalarData, RandomVectorData, and RandomMatrixData, respectively.
for i = 1:100

    % Store a random scalar, vector, and matrix in memory
    store(flgr, "RandomScalarData", rand, i);
    store(flgr, "RandomVectorData", rand(2,1), i);
    store(flgr, "RandomMatrixData", rand(5,5), i);

    % Write data from memory to a MAT file
    write(flgr);

end
Clean up the logger object. This operation performs cleanup tasks like for example, writing to file any data still in memory.
cleanup(flgr);
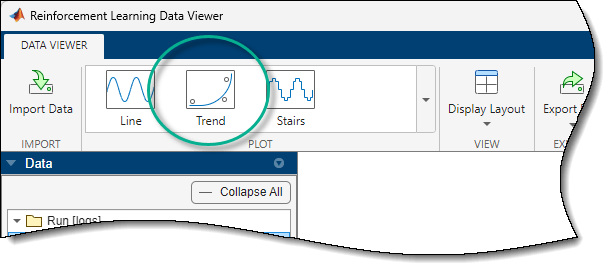
The Data pane of the Reinforcement Learning Data Viewer shows the three variables under the Run [logs] folder.
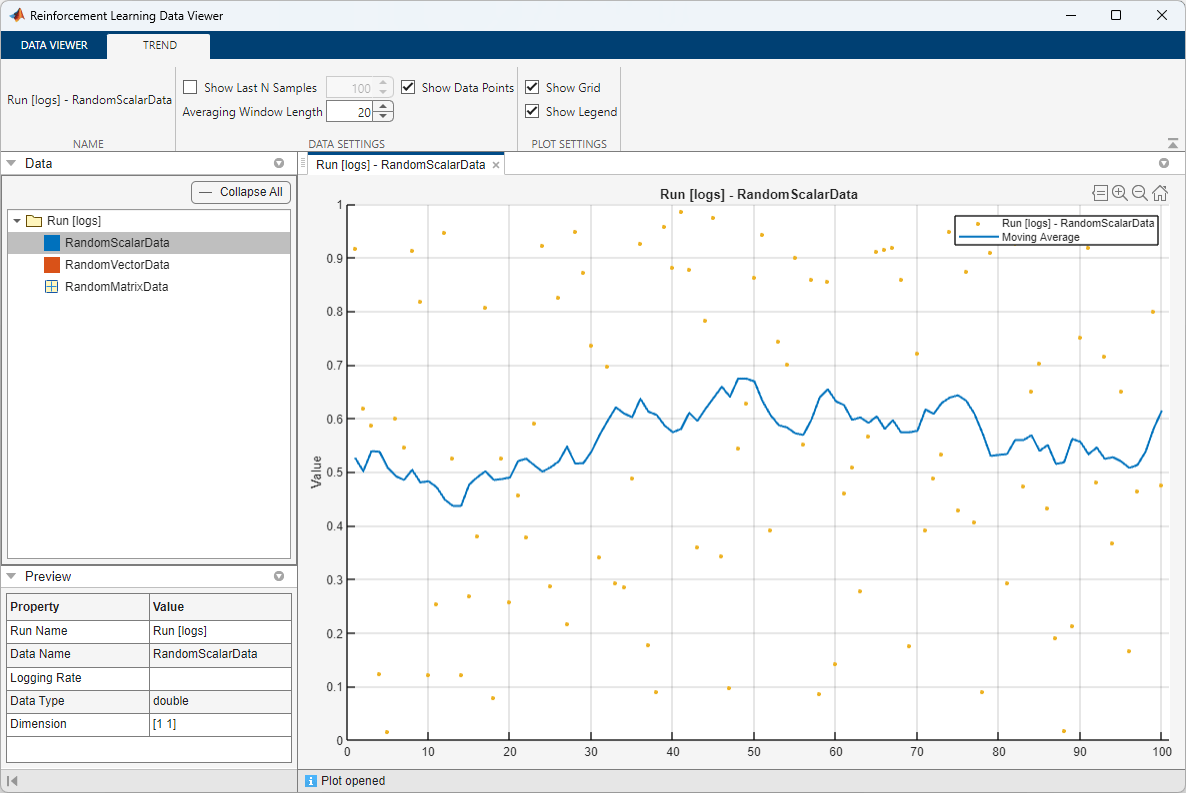
To select the first variable, click on RandomScalarData. The Preview pane then shows information such as the name, data type, and dimensions for this variable. To visualize a trend plot of the selected variable, on the Data Viewer tab, click Trend.
This action displays a moving average plot of the variable (using a 20-sample window), along with the data points.
To plot both elements of the second variable, select RandomVectorData in the Data pane and, in the Data Viewer tab, click Line Subplot.
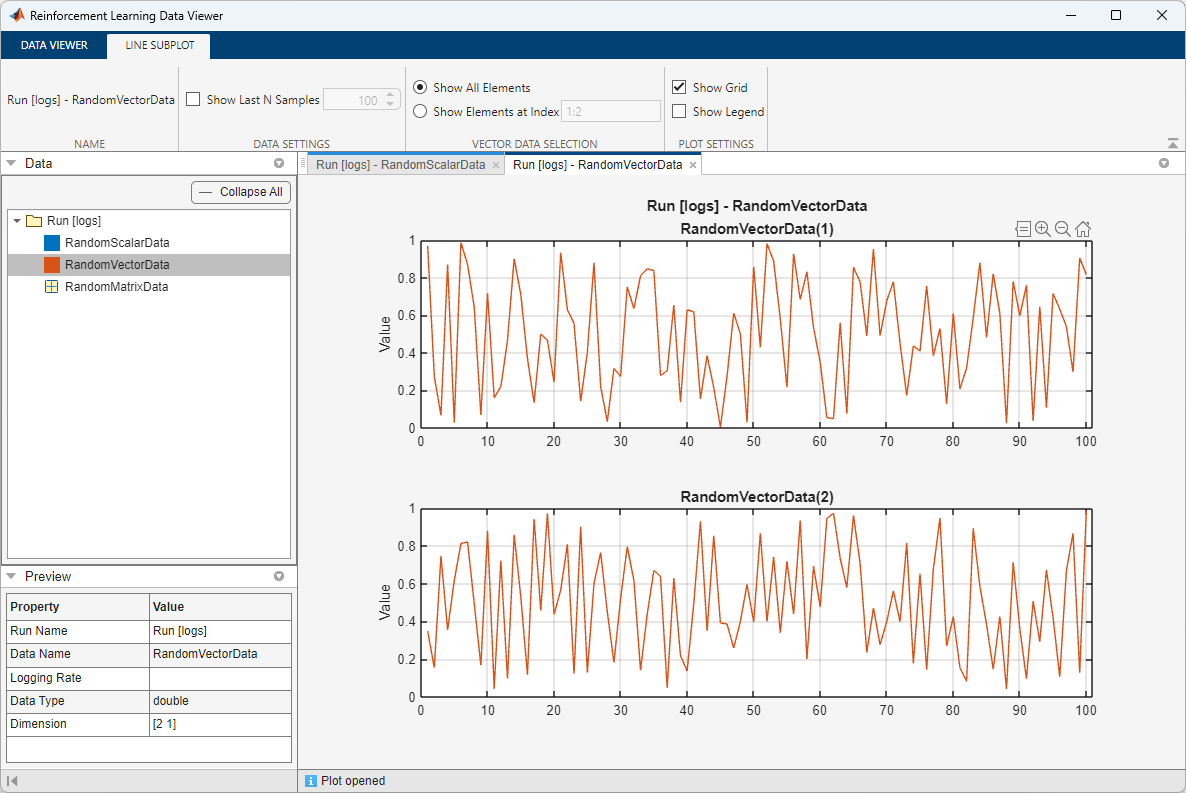
You can select multiple data histories (by holding the CTRL button while clicking their respective squares in the Data pane). When these data histories belong to the same run, the Multiple Lines button appears in the Data Viewer tab. This button allows you to visualize all the selected data in the same plot.
To show the value of RandomMatrixData in the last iteration as a heat map, select RandomMatrixData in the Data pane and, in the Data Viewer tab, click Image.
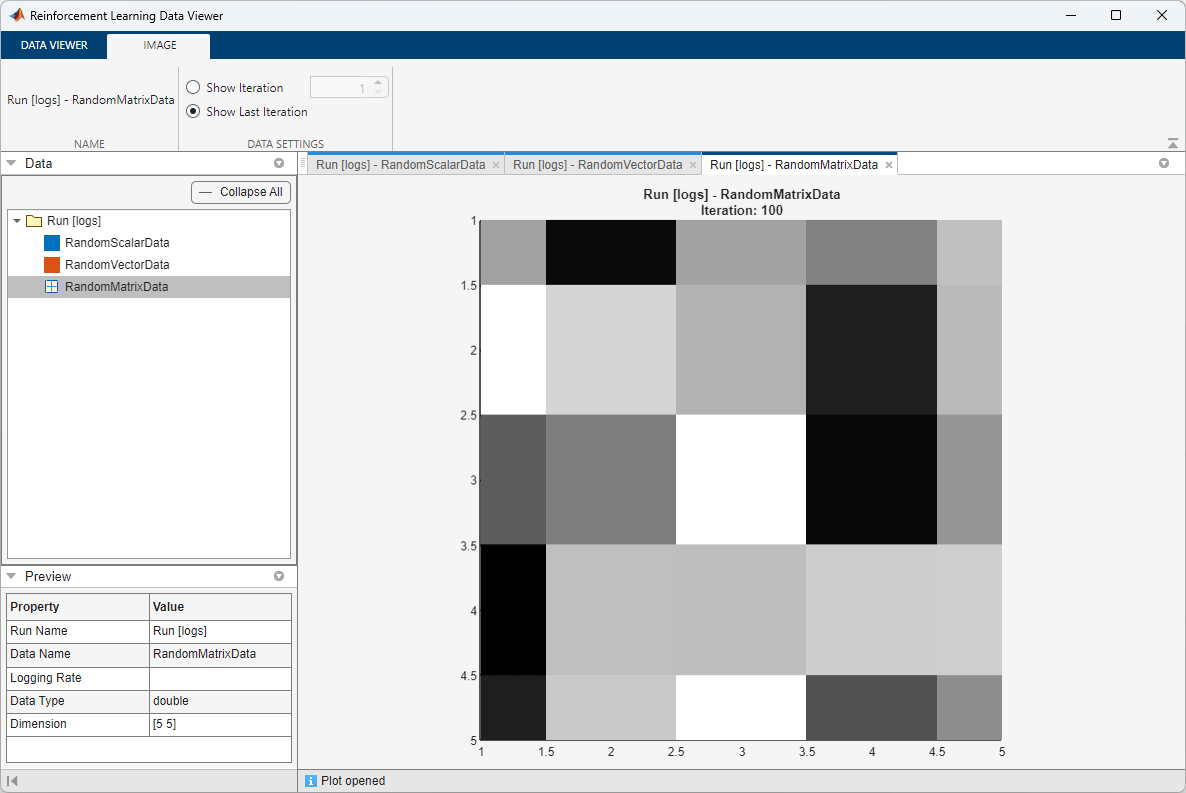
This image is a heatmap of the matrix, with black corresponding to the maximum value and white the minimum.
This example shows how to use the Reinforcement Learning Data Viewer to visualize data logged on disk.
To save data on the disk, use a FileLogger object and use it in a custom loop for three times.
flgr = rlDataLogger();
for run=1:3

    % Set up logger object
    setup(flgr);

    % Within a custom loop, store a 3-by-1 vector in the
    % variable rv and write it to disk at each iteration.
    for i = 1:20
        store(flgr, "rv", rand(2,1), i);
        write(flgr);
    end

    % Clean up logger object.
    cleanup(flgr);
end
When setup is used on an existing FileLogger object, a _1 suffix is added to the name of the destination folder. Therefore, the three loops result in data being saved in the folders logs, logs_1, and logs_1_1.
To visualize the saved data, open a Reinforcement Learning Data Viewer window using rlDataViewer.
rlDataViewer(["logs" "logs_1" "logs_1_1"]);
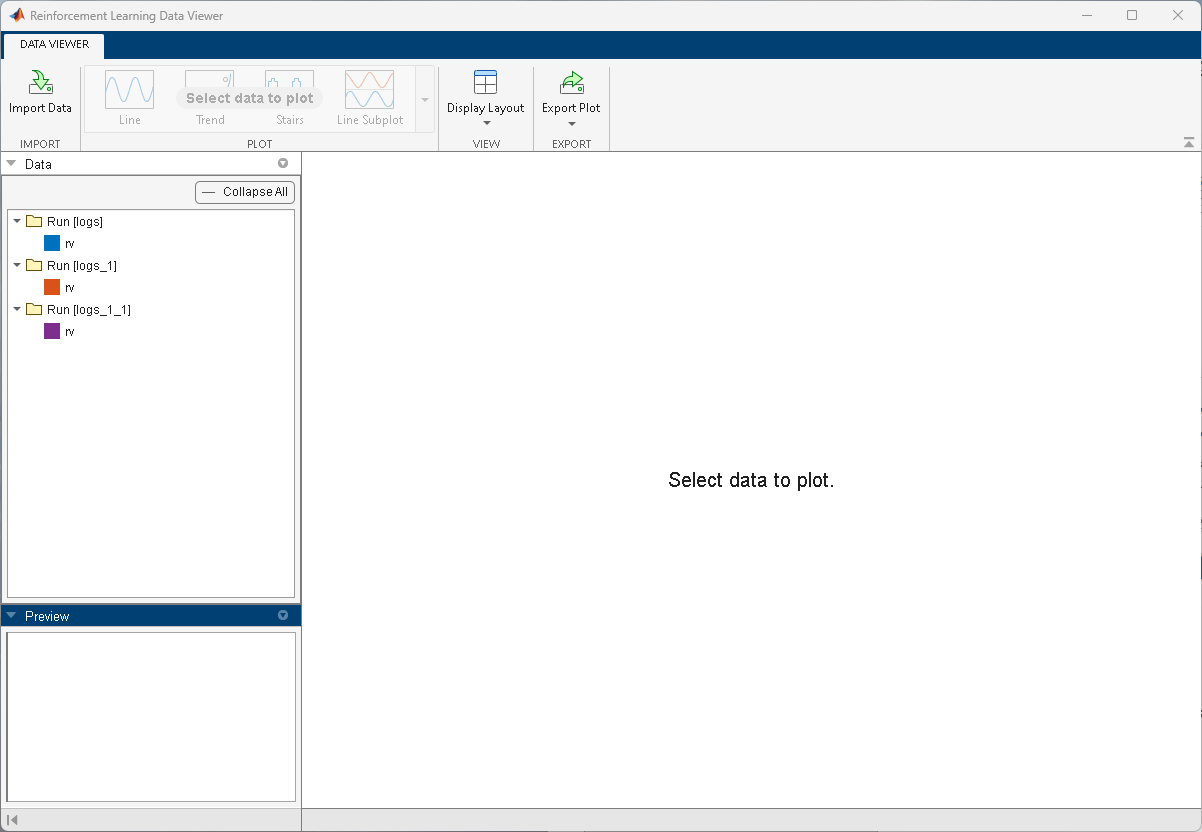
To plot the time history of rv in the second run, select the red rv square under the Run [logs_1] folder in the Data pane and, in the Data Viewer tab, click Line Subplot.
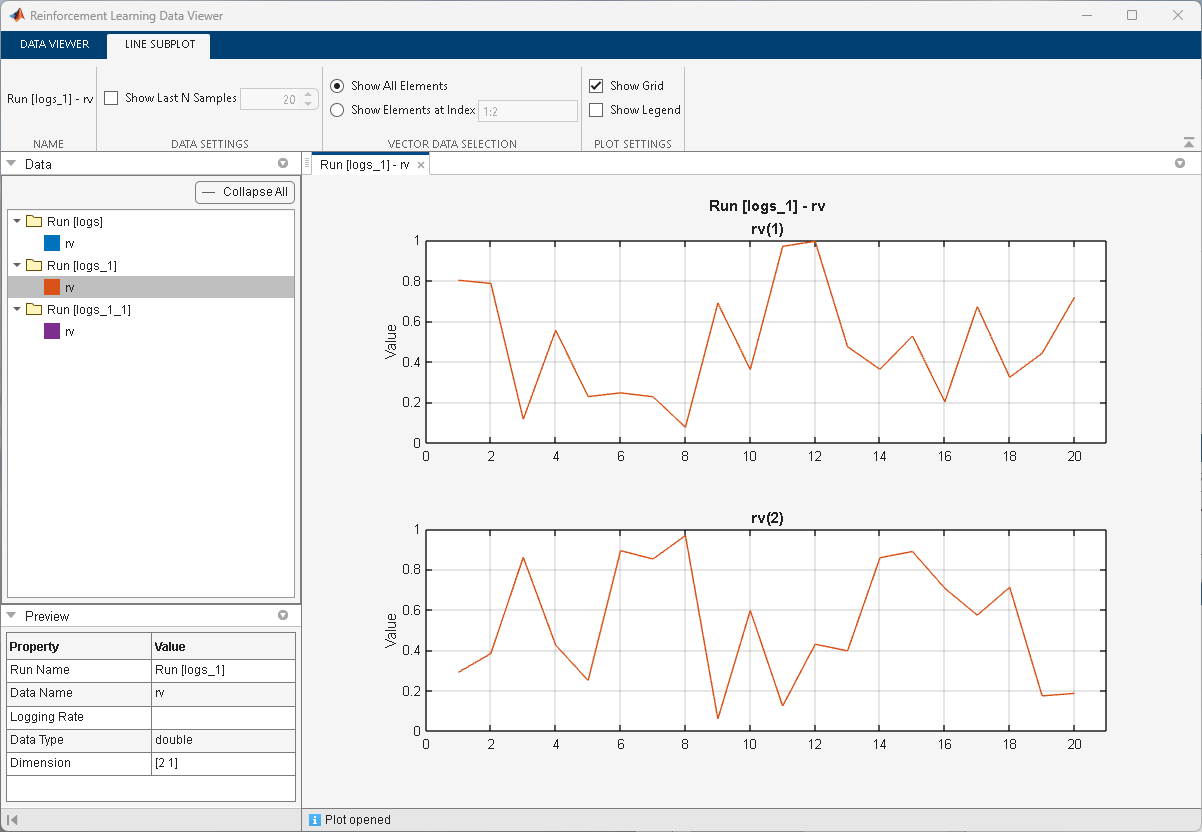
You can select multiple data histories (by holding the CTRL button while clicking their respective squares in the Data pane). When these data histories belong to the same run, the Multiple Lines button appears in the Data Viewer tab. This button allows you to visualize all the selected data in the same plot.
Input Arguments
Version History
Introduced in R2023a