view
Camera line of sight
Description
view( sets the
azimuth and elevation angles of the camera's line of sight for the current
axes.az,el)
view( sets the line of sight according to
v)v, which is a two- or three-element array:
Two-element array — The values are the azimuth and elevation angles respectively.
Three-element array — The values are the x-, y-, and z-coordinates of a vector that starts at the center of the plot box and points toward the camera. MATLAB® calculates the azimuth and elevation angles using a unit vector pointing in the same direction.
view( uses the default line of sight for
2-D or 3-D plots. Specify dim)dim as 2 for the default 2-D
view or 3 for the default 3-D view.
[caz,cel] = view(___) returns the azimuth and elevation
angles as caz and cel, respectively. Specify input
arguments from any of the previous syntaxes to get the angles for the new line of sight. Or,
specify no input arguments to get the angles for the current line of sight.
Examples
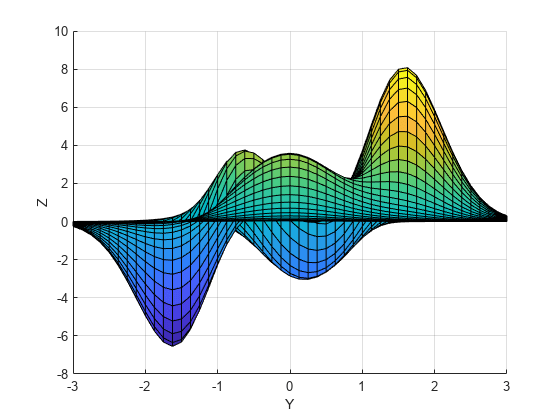
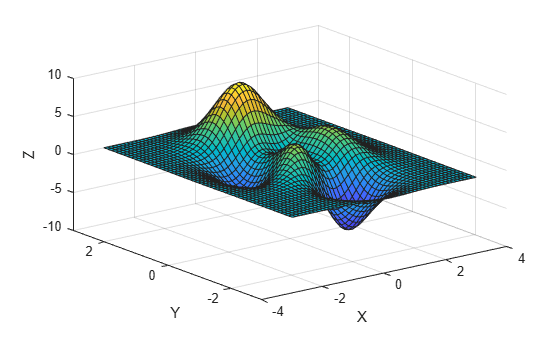
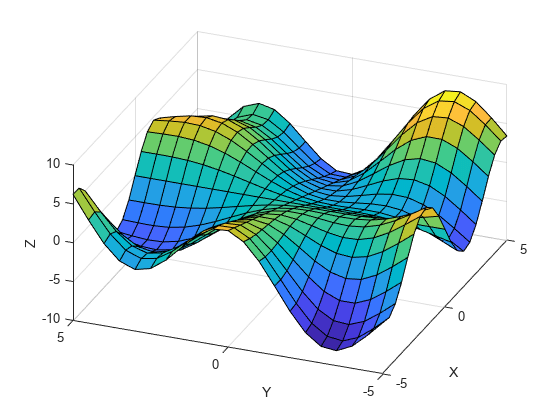
Use the peaks function to get the x-, y-, and z-coordinates of a surface. Then plot the surface and label each axis.
[X,Y,Z] = peaks;
surf(X,Y,Z)
xlabel('X')
ylabel('Y')
zlabel('Z')

View the plot using an azimuth of 90 degrees and an elevation of 0 degrees. The new line of sight is along the x-axis.
view(90,0)
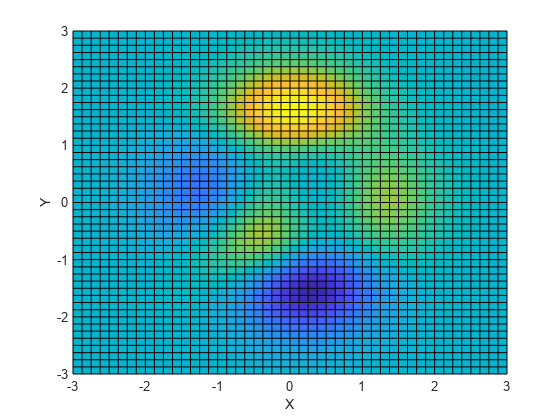
Use the peaks function to get the x-, y-, and z-coordinates of a surface. Then plot the surface and label each axis.
[X,Y,Z] = peaks;
surf(X,Y,Z)
xlabel('X')
ylabel('Y')
zlabel('Z')
Display the plot in a 2-D view.
view(2)
Create a set of x-, y-, and z-coordinates and use them to plot a surface. Then label each axis.
[X,Y] = meshgrid(-5:.5:5);
Z = Y.*sin(X) - X.*cos(Y);
surf(X,Y,Z)
xlabel('X')
ylabel('Y')
zlabel('Z')
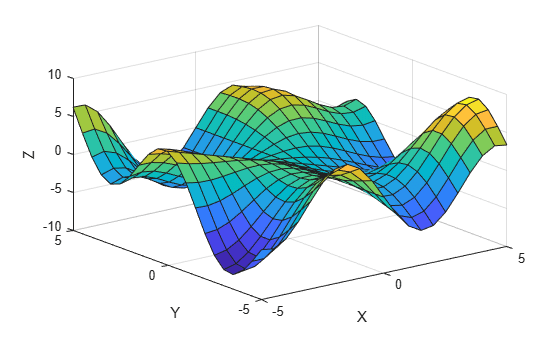
Get the azimuth and elevation angles for this plot.
[caz,cel] = view
caz =
-37.5000
cel =
30
Change the view by specifying v as the x- y- and z-coordinates of a vector, and return the new azimuth and elevation angles. The new angles are based on a unit vector pointing in the same direction as v.
v = [-5 -2 5];
[caz,cel] = view(v)
caz =
-68.1986
cel =
42.8760
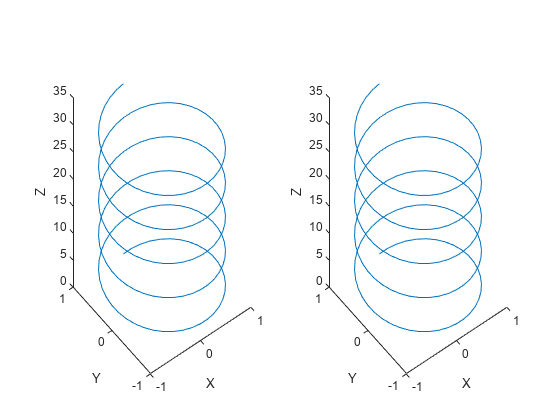
Starting in R2019b, you can display a tiling of plots using the tiledlayout and nexttile functions. Call the tiledlayout function to create a 1-by-2 tiled chart layout. Call the nexttile function to create the axes objects ax1 and ax2. Use them to create separate but identical line plots.
t = 0:pi/20:10*pi;
xt1 = sin(t);
yt1 = cos(t);
tiledlayout(1,2)

% Left plot
ax1 = nexttile;
plot3(ax1,xt1,yt1,t)
xlabel('X')
ylabel('Y')
zlabel('Z')

% Right plot
ax2 = nexttile;
plot3(ax2,xt1,yt1,t)
xlabel('X')
ylabel('Y')
zlabel('Z')
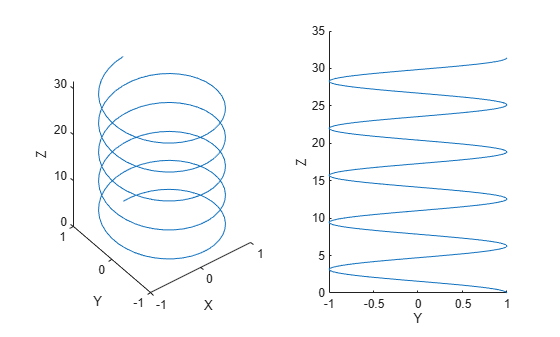
Change the view of the right plot to a side view along the x-axis.
view(ax2,[90 0]);
Input Arguments
Azimuth, specified as an angle in degrees from the negative y-axis. Increasing this angle corresponds to counterclockwise rotation about the z-axis when viewing the x-y plane from above.
The default value depends on whether your chart is in a 2-D or 3-D view. For 2-D
charts, the default value is 0. For 3-D charts, the default value is
-37.5.
Example: view(45,25) sets the azimuth to 45
degrees and the elevation to 25 degrees.
Elevation, specified the minimum angle in degrees between the line of sight and the
x-y plane. Increasing the elevation from
-90 to 90 degrees corresponds to a rotation from
the negative z-axis to the positive z-axis.
The default value depends on whether your chart is in a 2-D or 3-D view. For 2-D
charts, the default value is 90. For 3-D charts, the default value is
30.
Example: view(45,25) sets the azimuth to 45
degrees and the elevation to 25 degrees.
Line-of-sight vector, specified as one of the following:
A two-element array containing the azimuth and elevation angles respectively.
A three-element array containing the x-, y-, and z-coordinates of a vector that originates from the center of the plot box and points toward the camera. MATLAB calculates the azimuth and elevation from a unit vector pointing in the same direction. Thus, the magnitude of the
vhas no effect on the line of sight.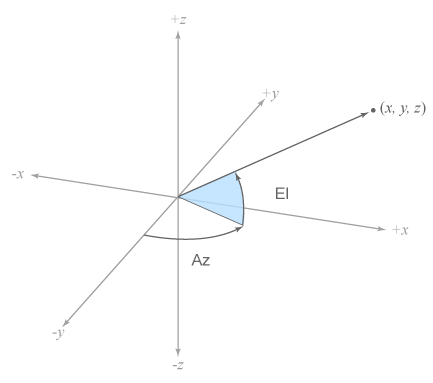
Example: view([45 25]) sets the azimuth to 45
degrees and the elevation to 25 degrees.
Example: view([20 25 5]) sets the line of sight to a vector that
points in the same direction as the vector [20 25 5].
Dimensions, specified as 2 or 3. This argument
sets the azimuth and elevation to the default values that MATLAB uses for a 2-D or 3-D plot.
Value of dim | Azimuth | Elevation |
|---|---|---|
2 | 0 | 90 |
3 | -37.5 | 30 |
Target axes, specified as:
An
Axesobject.An array of
Axesobjects. (Since R2022a)
If you do not specify this argument, then view modifies the
current axes.
More About
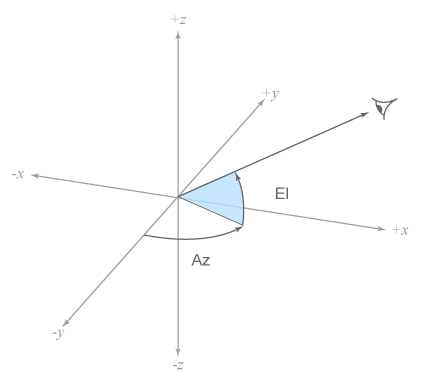
The line of sight starts at the center of the plot box and points toward the camera. MATLAB defines this line using two angles, the azimuth and the elevation. These angles are measured within a 3-D coordinate system that has its origin at the center of the plot box.
Azimuth — The angle of rotation around the z-axis, as measured from the negative y-axis. Increasing this angle corresponds to counterclockwise rotation about the z-axis when viewing the x-y plane from above.
Elevation — The minimum angle between the line of sight and the x-y plane. Increasing the elevation from
-90to90degrees corresponds to a rotation from the negative z-axis to the positive z-axis.
Tips
The
viewfunction controls the direction of the line of sight, but it does not control the location that the line starts from, nor the camera position. For more control, use the camera functions such ascampos,camtarget,camup,camva,camroll, andcamproj.Setting the azimuth and elevation angles might reset other camera-related properties. For best results, set the azimuth and elevation angles before setting other camera-related properties.