PeakFinderConfiguration
Compute and display the largest calculated peak values on the scope display
Since R2022a
Description
Use the PeakFinderConfiguration object to compute and display
peaks in the scope. The scope computes and displays peaks for only the portion of the input
signal that is currently on display in the scope.
You can specify the number of peaks you want the scope to display, the minimum height
above which you want the scope to detect peaks, the minimum distance between peaks, and label
the peaks. You can control the peak finder settings from the scope toolstrip or from the
command line. The algorithm defines a peak as a local maximum with lower values present on
either side of the peak. It does not consider end points as peaks. For more information on the
algorithm, see the findpeaks (Signal Processing Toolbox) function.
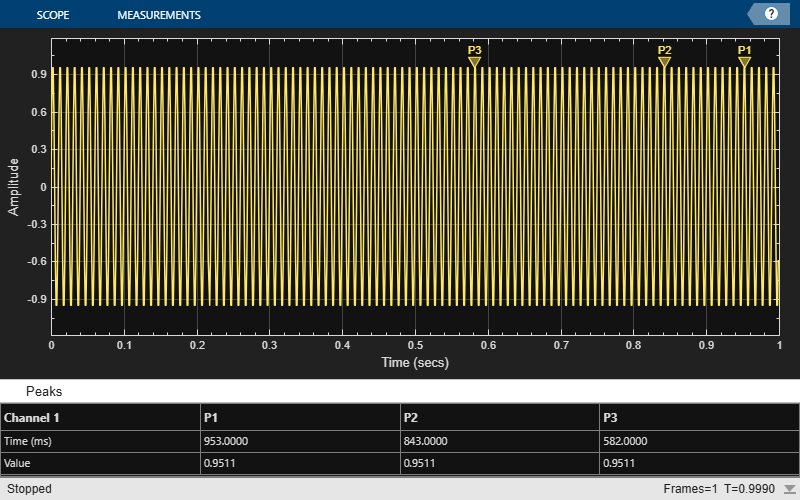
To modify the peak finder settings in the scope interface, click the Measurements tab and enable Peak Finder. Once you enable the Peak Finder, an arrow appears on the plot at each maxima and a Peaks panel appears at the bottom of the scope window.
Time Scope Toolstrip

Creation
Description
pkfinder = PeakFinderConfiguration() creates a peak finder
configuration object.
Properties
Examples
Create a sine wave and view it in the Time Scope. Enable the peak finder programmatically.
The timescope object requires one of these products:
DSP System Toolbox™
Navigation Toolbox™
Sensor Fusion and Tracking Toolbox™
Initialization
Create the input sine wave using the sin function. Create a timescope MATLAB® object to display the signal. Set the TimeSpan property to 1 second.
f = 100;
fs = 1000;
swv = sin(2.*pi.*f.*(0:1/fs:1-1/fs)).';
scope = timescope(SampleRate=fs,...
    TimeSpanSource="property", ...
    TimeSpan=1);
Peaks
Enable the peak finder and label the peaks. Set the scope to show three peaks and label them.
scope.PeakFinder.Enabled = true;
scope.PeakFinder.LabelPeaks = true;
scope(swv)
release(scope)
Version History
Introduced in R2022a