Detect ARCH Effects
Test Autocorrelation of Squared Residuals
This example shows how to inspect a squared residual series for autocorrelation by plotting the sample autocorrelation function (ACF) and partial autocorrelation function (PACF). Then, conduct a Ljung-Box Q-test to more formally assess autocorrelation.
Load the Data.
Load the NASDAQ data included with the toolbox. Convert the daily close composite index series to a percentage return series.
load Data_EquityIdx;
y = DataTable.NASDAQ;
r = 100*price2ret(y);
T = length(r);

figure
plot(r)
xlim([0,T])
title('NASDAQ Daily Returns')
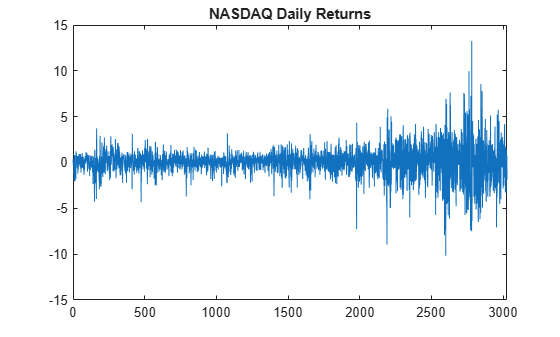
The returns appear to fluctuate around a constant level, but exhibit volatility clustering. Large changes in the returns tend to cluster together, and small changes tend to cluster together. That is, the series exhibits conditional heteroscedasticity.
The returns are of relatively high frequency. Therefore, the daily changes can be small. For numerical stability, it is good practice to scale such data.
Plot the Sample ACF and PACF.
Plot the sample ACF and PACF for the squared residual series.
e = r - mean(r);

figure
subplot(2,1,1)
autocorr(e.^2)
subplot(2,1,2)
parcorr(e.^2)
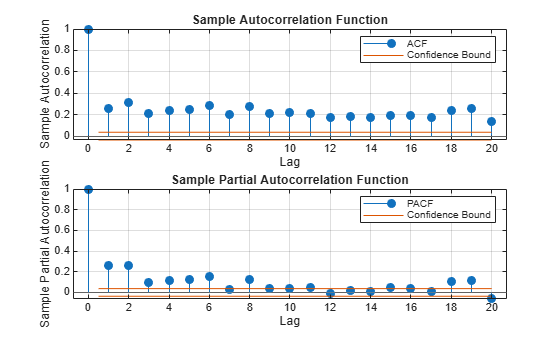
The sample ACF and PACF show significant autocorrelation in the squared residual series. This indicates that volatility clustering is present in the residual series.
Conduct a Ljung-Box Q-test.
Conduct a Ljung-Box Q-test on the squared residual series at lags 5 and 10.
[h,p] = lbqtest(e.^2,'Lags',[5,10])h = 1×2 logical array
1 1
p = 1×2

     0     0
The null hypothesis is rejected for the two tests (h = 1). The p values for both tests is 0. Thus, not all of the autocorrelations up to lag 5 (or 10) are zero, indicating volatility clustering in the residual series.
Conduct Engle's ARCH Test
This example shows how to conduct Engle's ARCH test for conditional heteroscedasticity.
Load and Preprocess Data
Load the NASDAQ data included with the toolbox. Convert the daily close composite index series to a return series.
load Data_EquityIdx
ReturnsTbl = price2ret(DataTable);

figure
plot(ReturnsTbl.NASDAQ)
title('NASDAQ Daily Returns')
axis tight
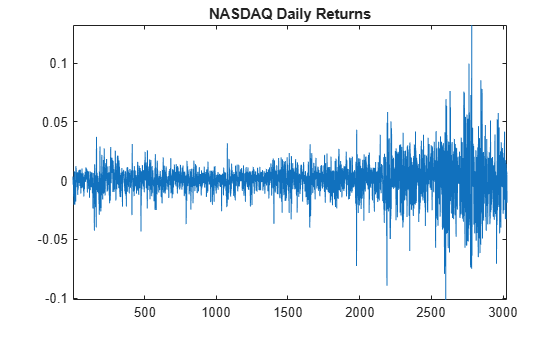
The returns appear to fluctuate around a constant level, but exhibit volatility clustering. Large changes in the returns tend to cluster together, and small changes tend to cluster together. That is, the series exhibits conditional heteroscedasticity.
The returns are of relatively high frequency. Therefore, the daily changes can be small. For numerical stability, it is good practice to scale such data.
Conduct Engle's ARCH Test
Conduct Engle's ARCH test for conditional heteroscedasticity on the residual series from a fit of the percent returns series to a constant-only model. Specify two lags in the alternative hypothesis.
ReturnsTbl.Residuals_NASDAQ = 100*(ReturnsTbl.NASDAQ - mean(ReturnsTbl.NASDAQ));
StatTbl = archtest(ReturnsTbl,DataVariable="Residuals_NASDAQ",Lags=2)StatTbl=1×6 table
h pValue stat cValue Lags Alpha
_____ ______ ______ ______ ____ _____
Test 1 true 0 399.97 5.9915 2 0.05
The null hypothesis is soundly rejected (h = 1, p = 0) in favor of the ARCH(2) alternative. The F statistic for the test is 399.97, much larger than the critical value from the distribution with two degrees of freedom, 5.99.
The test concludes there is significant volatility clustering in the residual series.
See Also
archtest | autocorr | lbqtest | parcorr