SpectrumAnalyzerBlockConfiguration
Configure Spectrum Analyzer block
Description
The SpectrumAnalyzerBlockConfiguration object contains the
scope configuration information for the Spectrum Analyzer block.
Creation
MyScopeConfiguration = get_param(gcbh,'ScopeConfiguration')
constructs a new spectrum analyzer configuration object. You must first select the block
in the model or provide the full path to the block.
Properties
Frequently Used
Number of input ports on a scope block, specified as a character vector or string scalar. The maximum number of input ports that you can specify is 96.
Scope Window Use
Click Settings in the Scope tab and specify Num Inputs.
Data Types: char | string
The domain of the input signal you want to visualize, specified as
"Time" or "Frequency". If you visualize
time-domain signals, the Spectrum Analyzer transforms the signal to the frequency
spectrum based on the algorithm specified in the Method
property.
Scope Window Use
In the Estimation tab on the Spectrum Analyzer toolstrip, set
Input Domain to Time or
Frequency.
Data Types: char | string
Spectrum type, specified as one of these:
"Power" — Power spectrum
"Power density" — Power spectral density. The power spectral
density is the magnitude squared of the spectrum normalized to a bandwidth of 1
Hz.
"RMS" — Root mean square. The root mean square shows the square
root of the mean square. Use this option to view the frequency of voltage or current
signals.
Tunable: Yes
Dependency
To enable this property, set InputDomain to
"Time".
Scope Window Use
In the Scope tab on the Spectrum Analyzer toolstrip, select
Spectrum. Click Spectrum to select
Power, Power Density, or
RMS.
To enable these options, set the Input
Domain on the Estimation tab to
Time.
Data Types: char | string
Viewer type, specified as one of these values:
"Spectrum"— Show the power spectrum."Spectrogram"— Show frequency content over time. Each line of the spectrogram is one periodogram. Time scrolls from the bottom to the top of the display. The most recent spectrogram update is at the bottom of the display."Spectrum and Spectrogram"— Show spectrum and spectrogram.
To learn more about how the Spectrum Analyzer computes the spectrum and spectrogram, see the Algorithms section in the Spectrum Analyzer block reference page.
Tunable: Yes
Scope Window Use
In the Scope tab on the Spectrum Analyzer toolstrip, select Spectrum, Spectrogram, or both.
Data Types: char | string
Source of the input sample rate, specified as one of these:
"Inherited"— Spectrum Analyzer inherits the input sample rate from the model."Property"— Specify the sample rate input directly using theSampleRateproperty.
Scope Window Use
Click the Scope tab on the Spectrum Analyzer toolstrip. In the
Bandwidth section, set Sample Rate
(Hz) to Inherited or specify a finite
scalar.
Data Types: char | string
Sample rate of the input signal in Hz, specified as a character vector or a string scalar of a positive scalar.
Dependency
To enable this property, set SampleRateSource to "Property".
Scope Window Use
Click the Scope tab on the Spectrum Analyzer toolstrip. In the Bandwidth section, specify Sample Rate (Hz) to a finite scalar.
Data Types: char | string
Spectrum estimation method, specified as one of the following:
"Filter bank"–– Use an analysis filter bank to estimate the power spectrum. Compared to Welch's method, this method has a lower noise floor, better frequency resolution, lower spectral leakage, and requires fewer samples per update."Welch"–– Use Welch's method of averaged modified periodograms.
For more information on these methods, see Algorithms.
Tunable: Yes
Dependency
To enable this property, set InputDomain to
"Time".
Scope Window Use
In the Estimation tab of the Spectrum
Analyzer toolstrip, set Estimation Method to
Filter bank or
Welch.
To enable this parameter, set Input Domain to
Time in the
Estimation tab.
Data Types: char | string
Option to plot a two-sided spectrum, specified as one of the following:
true— Compute and plot two-sided spectral estimates. When the input signal is complex valued, you must set this property totrue.false— Compute and plot one-sided spectral estimates. If you set this property tofalse, then the input signal must be real valued.When you set this property to
false, the Spectrum Analyzer uses power-folding. The y-axis values are twice the amplitude that they would be if you were to set this property totrue, except at0and the Nyquist frequency. A one-sided power spectral density (PSD) contains the total power of the signal in the frequency interval from DC to half the Nyquist rate. For more information, seepwelch.
Tunable: Yes
Scope Window Use
Click the Spectrum tab or the Spectrogram tab (if enabled) of the Spectrum Analyzer toolstrip. In the Trace Options section, select Two-Sided Spectrum to compute and plot two-sided spectral estimates.
Data Types: logical
Scale to display frequency, specified as one of the following:
"Linear"— Use a linear scale to display frequencies on the x-axis. To use the"Linear"option, you must also set thePlotAsTwoSidedSpectrumproperty totrue."Log"— Use a logarithmic scale to display frequencies on the x-axis. To use the"Log"option, you must also set thePlotAsTwoSidedSpectrumproperty tofalse.
Tunable: Yes
Scope Window Use
Click the Spectrum tab or the
Spectrogram tab (if enabled) on the
Spectrum Analyzer toolstrip. In the Scale
section, set the Frequency Scale to
Linear or
Log.
To set the Frequency Scale to
Log, clear the Two-Sided
Spectrum check box in the Trace
Options section in the Spectrum
or the Spectrogram tab (if enabled). If you
select the Two-Sided Spectrum check box, then
you must set the Frequency Scale to
Linear.
Data Types: char | string
Plot type to display normal traces, specified as "Line",
"Stem", a cell array of these character vectors, or an array of
these strings. Normal traces are traces that display free-running spectral
estimates.
You can individually control the type of plot
for each line by specifying the PlotType property as a cell array
of character vectors or an array of strings. (since R2025a)
Tunable: Yes
Dependencies
To enable this property, set:
ViewTypeto"Spectrum"or"Spectrum and spectrogram".PlotNormalTracetotrue.
Scope Window Use
Click the Scope tab on the Spectrum Analyzer toolstrip,
navigate to the Configuration section and click
Settings. In the Spectrum Analyzer Settings window, under
Display and Labels, set Plot Type to
Line or Stem.
To enable the Plot Type, you must:
Select Spectrum in the Views section of the Scope tab.
Enable the Normal Trace check box in the Trace Options section of the Spectrum tab.
Data Types: char | string
Axes scaling mode, specified as one of these:
"Auto"— The scope scales the axes to fit the data, both during and after simulation."Manual"— The scope does not scale the axes automatically."OnceAtStop"— The scope scales the axes when the simulation stops."Updates"— The scope scales the axes after a specific number of visual updates. It determines the number of updates using theAxesScalingNumUpdatesproperty.
Tunable: Yes
Data Types: char | string
Number of updates before scaling, specified as a character vector or a string scalar of a positive integer.
Tunable: Yes
Dependency
To enable this property, set AxesScaling to
"Updates".
Data Types: char | string
Advanced
Since R2024a
Frequency resolution method of the spectrum analyzer, specified as one of these options.
"RBW"–– TheRBWSourceandRBWproperties control the frequency resolution (in Hz) of the analyzer."Number of frequency bands"–– Applies only when you setMethodto"filter-bank". TheFFTLengthSourceandFFTLengthproperties control the frequency resolution."Window length"–– Applies only when you setMethodto"welch". TheWindowLengthproperty controls the frequency resolution.
Tunable: Yes
Dependency
To enable this property, set InputDomain to
"Time".
Scope Window Use
Click the Estimation tab on the Spectrum Analyzer toolstrip. In the Frequency Resolution section, set Resolution Method to one of the available options.
Data Types: char | string
Source of the resolution bandwidth (RBW) value, specified as one of these:
"Auto"— The Spectrum Analyzer adjusts the spectral estimation resolution to ensure that there are 1024 RBW intervals over the defined frequency span."Property"— Specify the resolution bandwidth directly using theRBWproperty."InputPort"— An input port appears on the Spectrum Analyzer block through which you specify the RBW. You can use this option only for frequency inputs.
Tunable: Yes
Scope Window Use
Click the Estimation tab on the Spectrum Analyzer toolstrip. In the
Frequency Resolution section, set RBW
(Hz) to Auto, Input
port or to a positive scalar.
Data Types: char | string
Resolution bandwidth (RBW) in Hz, specified as a character vector or a string scalar of a positive scalar. Specify the value to ensure that there are at least two RBW intervals over the specified frequency span. The ratio of the overall span to RBW satisfies this condition:
You can specify the overall span in different ways based on how you set the
FrequencySpan property.
RBW controls the spectral resolution of the displayed signal. The RBW value determines the spacing between frequencies that can be resolved. A smaller value gives a higher spectral resolution and lowers the noise floor, that is, the Spectrum Analyzer can resolve frequencies that are closer to each other. However, this comes at the cost of a longer sweep time.
Dependency
To enable this property, set RBWSource to
"Property".
Scope Window Use
Click the Estimation tab on the Spectrum Analyzer toolstrip. In the Frequency Resolution section, set RBW (Hz) to a positive scalar.
Tunable: Yes
Data Types: char | string
Since R2024b
Set this property to true to maintain the number of
samples per update Nsamples at
1024 regardless of the window you select in the
Window property. The RBW value adjusts
according to the window you select.
where:
Op is the overlap percentage you specify in the
OverlapPercentproperty.Fs is the sample rate you specify using the
SampleRateSourceandSampleRateproperties.RBW is the resolution bandwidth you specify in the
RBWSourceandRBWproperties.NENBW is the normalized effective noise bandwidth. For more information, see the Spectrum Analyzer block reference page.
When you set this parameter to false or
0, the object maintains the same RBW value and
adjusts the number of samples required per update
Nsamples depending on
the window you select.
Dependencies
To enable this property, set:
Methodto"Welch".FrequencyResolutionMethodto"RBW".RBWSourceto"Auto".
Tunable: Yes
Data Types: logical
Since R2024a
Window length in samples that is used to compute the spectral estimates, specified as an integer greater than 2. This property controls the frequency resolution based on the value of the window length.
Tunable: Yes
Dependencies
To enable this property, set:
Methodto"Welch".FrequencyResolutionMethodto"Window length".
Scope Window Use
Click the Estimation tab on the Spectrum Analyzer toolstrip. In the Frequency Resolution section, set the Window Length to a positive integer greater than 2.
To enable Window Length, set:
Estimation Method to
Welch.Resolution Method to
Window length.
Since R2024a
Source of the FFT length, specified as one of these:
"Auto"–– The value of FFT length depends on the setting of the frequency resolution method. When you set:FrequencyResolutionMethodto"RBW", the FFT length equals the number of samples per update, Nsamples. For more details on Nsamples, see the Algorithms section in the Spectrum Analyzer page.FrequencyResolutionMethodto"Window length", the FFT length equals the value you specify in theWindowLengthproperty or 1024, whichever is larger.FrequencyResolutionMethodto"Number of frequency bands", the FFT length equals the input frame size (number of rows).
"Property"–– The number of FFT points equals the value you specify in theFFTLengthproperty.
Tunable: Yes
Dependency
To enable this property, set:
Methodto"Welch".Methodto"Filter bank"andFrequencyResolutionMethodto"Number of frequency bands".
Scope Window Use
Click the Estimation tab on the Spectrum
Analyzer toolstrip. In the Frequency Resolution
section, set the FFT Length to
Auto or a positive integer.
Data Types: char | string
Since R2024a
Length of the FFT that the spectrum analyzer uses to compute spectral estimates, specified as a positive integer.
Tunable: Yes
Dependencies
To enable this property, set FFTLengthSource
to "Property".
Scope Window Use
Click the Estimation tab on the spectrum
analyzer toolstrip. In the Frequency Resolution
section, set the FFT Length to
Auto or a positive integer.
Sharpness of the prototype lowpass filter, specified as a character vector or a string scalar of a real nonnegative scalar in the range [0,1].
Increasing the filter sharpness decreases the spectral leakage and gives a more accurate power reading.
Tunable: Yes
Dependencies
To enable this property, set:
InputDomainto"Time".Methodto"Filter Bank".
Scope Window Use
Click the Estimation tab on the Spectrum Analyzer toolstrip. In the Frequency Resolution section, set Filter Sharpness.
To enable this parameter, set Input Domain to
Time and Estimation
Method to Filter bank in
the Estimation tab.
Data Types: char | string
Frequency span mode, specified as one of the following:
"Full"–– The Spectrum Analyzer computes and plots the spectrum over the entire Nyquist Frequency Interval."Span and center frequency"–– The Spectrum Analyzer computes and plots the spectrum over the interval specified by theSpanandCenterFrequencyproperties."Start and stop frequencies"–– The Spectrum Analyzer computes and plots the spectrum over the interval specified by theStartFrequencyandStopFrequencyproperties.
Tunable: Yes
Dependency
To enable this property, set InputDomain to
"Time".
Scope Window Use
Click the Estimation tab on the Spectrum
Analyzer toolstrip. In the Frequency Options
section, set Frequency Span to
Full, Span and Center
Frequency, or Start and Stop
Frequencies.
To enable the Frequency Span, set
Input Domain to
Time.
Data Types: char | string
Frequency span over which the Spectrum Analyzer computes and plots the
spectrum, specified as a character vector or a string scalar of a real
positive scalar in Hz. The overall span, defined by this property and
the CenterFrequency property, must fall within the
Nyquist Frequency Interval.
Tunable: Yes
Dependency
To enable this property, set:
InputDomainto"Time".FrequencySpanto"Span and center frequency".
Data Types: char | string
Center of the frequency span over which the Spectrum Analyzer computes
and plots the spectrum, specified as a character vector or a string
scalar of a real scalar in Hz. The overall frequency span, defined by
Span and this property, must fall within the
Nyquist Frequency Interval.
Tunable: Yes
Dependency
To enable this property, set:
InputDomainto"Time".FrequencySpanto"Span and center frequency".
Scope Window Use
Click the Estimation tab on the Spectrum
Analyzer toolstrip. In the Frequency Options
section, set Frequency Span to
Span and Center Frequency and
Center Frequency (Hz) to a real
scalar.
To enable the Frequency Span, set
Input Domain to
Time.
Data Types: char | string
Starting frequency value in the frequency interval over which the
Spectrum Analyzer computes and plots the spectrum, specified as a
character vector or a string scalar of a real scalar in Hz. The overall
span, which is defined by this property and
StopFrequency, must fall within the Nyquist Frequency Interval.
Tunable: Yes
Dependency
To enable this property, set:
InputDomainto"Time".FrequencySpanto"Start and stop frequencies".
Scope Window Use
Click the Estimation tab on the Spectrum
Analyzer toolstrip. In the Frequency Options
section, set Frequency Span to
Start and Stop Frequencies and
Start Frequency (Hz) to a real
scalar.
To enable the Frequency Span, set
Input Domain to
Time.
Data Types: char | string
Ending frequency value in the frequency interval over which the
Spectrum Analyzer computes and plots the spectrum, specified as a
character vector or a string scalar of a real scalar in Hz. The overall
span, which is defined by this property and the
StartFrequency property, must fall within the
Nyquist Frequency Interval.
Tunable: Yes
Dependency
To enable this property, set:
InputDomainto"Time".FrequencySpanto"Start and stop frequencies".
Scope Window Use
Click the Estimation tab on the Spectrum
Analyzer toolstrip. In the Frequency Options
section, set Frequency Span to
Start and Stop Frequencies and
Stop Frequency (Hz) to a real
scalar.
To enable the Frequency Span, set
Input Domain to
Time.
Data Types: char | string
Overlap percentage between the previous and current buffered data segments, specified as a character vector or string scalar of a real scalar in the range [0 100). The overlap creates a window segment that the Spectrum Analyzer uses to compute a spectral estimate.
Tunable: Yes
Dependency
To enable this property, set:
InputDomainto"Time".Methodto"Welch"
Scope Window Use
Click the Estimation tab on the Spectrum Analyzer toolstrip. In the Window Options section, set the Overlap (%).
To enable the Overlap
(%), set Input Domain to
Time and Estimation Method to
Welch in the Estimation tab on
the Spectrum Analyzer toolstrip.
Data Types: char | string
Specify a window function for the spectral estimator. You can select one of the window options in the following table or specify a custom window. For more information on the window functions, click the link to the function reference page in the Signal Processing Toolbox™ documentation.
| Window Option | Corresponding Signal Processing Toolbox Function |
|---|---|
"Rectangular" | rectwin |
"Chebyshev" | chebwin |
"Flat Top" | flattopwin |
"Hamming" | hamming |
"Hann" | hann |
"Kaiser" | kaiser |
"Blackman-Harris" | blackmanharris |
To set your own spectral estimation window, set this property to
"Custom" and specify a custom window function in
the CustomWindow property.
Tunable: Yes
Dependency
To enable this property, set:
InputDomainto"Time".Methodto"Welch"
Scope Window Use
Click the Estimation tab on the Spectrum Analyzer toolstrip. In the Window Options section, set the Window.
To enable the Window, set Input
Domain to Time and
Estimation Method to
Welch in the
Estimation tab on the Spectrum Analyzer
toolstrip.
Data Types: char | string
Name of the custom window function, specified as a character vector or string scalar. The name of the custom window function must be on the MATLAB® path. Use this property if you want to customize the window using additional properties available with the Signal Processing Toolbox version of the window function.
Tunable: Yes
Example
Define and use a custom window function.
function w = my_hann(L)
    w = hann(L, 'periodic')
end

scope.Window = 'Custom';
scope.CustomWindow = 'my_hann'
Dependency
To use this property, set Window to
"Custom".
Scope Window Use
Click the Estimation tab on the Spectrum Analyzer toolstrip. In the Window Options section, for the Window, enter the name of the custom window function.
Data Types: char | string
Sidelobe attenuation of the window in decibels (dB), specified as a
character vector or a string scalar of a positive scalar greater than or
equal to 45.
Tunable: Yes
Dependency
To enable this property, set Window to
"Chebyshev" or "Kaiser".
Scope Window Use
Click the Estimation tab on the Spectrum Analyzer toolstrip. In the Window Options section, set the Attenuation (dB).
To enable the Attenuation (dB), set:
Input Domain to
TimeEstimation Method to
WelchWindow to either
ChebyshevorKaiserin the Estimation tab on the Spectrum Analyzer toolstrip.
Data Types: char | string
Averaging method, specified as one of these:
"VBW"— Video bandwidth method. The object uses a lowpass filter to smooth the trace and decrease noise. Use theVBWSourceandVBWproperties to specify the VBW value."Exponential"— Weighted average of samples. The object computes the average over samples weighted by an exponentially decaying forgetting factor. Use theForgettingFactorproperty to specify the weighted forgetting factor."Running"–– Running average of the last Q samples. Use theSpectralAveragesproperty to specify Q. (since R2025a)
For more information, see Averaging Method.
Tunable: Yes
Dependency
To enable this property, set InputDomain to
"Time".
Scope Window Use
Click the Estimation tab on the spectrum
analyzer toolstrip. In the Averaging section,
set Averaging Method to
VBW,
Exponential, or
Running.
To enable the Averaging Method, set
Input Domain to
Time.
Data Types: char | string
Source of the video bandwidth (VBW), specified as one of these options:
"Auto"— The Spectrum Analyzer adjusts the VBW such that the equivalent forgetting factor is 0.9."Input port"–– An input port appears on the scope and you can specify the VBW value through this port."Property"— The Spectrum Analyzer adjusts the VBW using the value specified in theVBWproperty.
For more details on the video bandwidth method, see Averaging Method.
Tunable: Yes
Dependency
To enable this property, set InputDomain to
"Time" and
AveragingMethod to
"VBW".
Scope Window Use
Click the Estimation tab on the Spectrum
Analyzer toolstrip. In the Averaging section,
set VBW (Hz) to either
Auto or a positive real scalar less
than or equal to Sample Rate (Hz)/2.
To enable the VBW (Hz), set Input
Domain to Time and
Averaging Method to
VBW.
Data Types: char | string
Video bandwidth, specified as a character vector or a string scalar of
a positive scalar less than or equal to
SampleRate/2. For more information on the video
bandwidth method, see Averaging Method.
Tunable: Yes
Dependency
To enable this property, set VBWSource to
"Property".
Scope Window Use
Click the Estimation tab on the Spectrum
Analyzer toolstrip. In the Averaging section,
set VBW (Hz) to either
Auto or enter a positive real scalar
that is less than or equal to Sample Rate
(Hz)/2.
To enable the VBW (Hz), set Input
Domain to Time and
Averaging Method to
VBW.
Data Types: double
Forgetting factor of the exponential weighted averaging method, specified as a character vector or string scalar of a real scalar in the range (0,1].
Tunable: Yes
Dependency
To enable this property, set:
InputDomainto"Time"AveragingMethodto"Exponential"
Scope Window Use
Click the Estimation tab on the Spectrum Analyzer toolstrip. In the Averaging section, set Forgetting Factor.
To enable the Forgetting Factor, set
Input Domain to
Time and Averaging
Method to
Exponential.
Data Types: char | string
Since R2025a
Number of spectral averages Q, specified as a positive integer.
The spectrum analyzer computes the current power spectrum estimate by computing a running average of the last Q power spectrum estimates.
Dependency
To enable this property, set:
InputDomainto"Time".AveragingMethodto"Running".
Scope Window Use
Click the Estimation tab on the spectrum
analyzer toolstrip. In the Averaging section,
set Averaging Method to
Running and Spectral
Averages to a positive integer.
To enable the Averaging Method, set
Input Domain to
Time.
Data Types: double
Source of the frequency vector, specified as one of the following:
"Auto"— The Spectrum Analyzer computes the frequency vector based on the frame size of the input signal and the specified sample rate. For more details, see Frequency Vector."Property"— Enter a custom vector in theFrequencyVectorproperty."InputPort"— An input port appears on the Spectrum Analyzer block. Specify the frequency vector input through this port.
Tunable: Yes
Dependency
To enable this property, set InputDomain to
"Frequency".
Scope Window Use
Click the Estimation tab on the Spectrum
Analyzer toolstrip. In the Domain section,
set Frequency (Hz) to
Auto, Input
port, or a monotonically increasing vector of
length equal to the input signal frame size.
To enable the Frequency (Hz), set
Input Domain to
Frequency.
Data Types: char | string
Custom frequency vector, specified as a monotonically increasing vector. This vector determines the x-axis in the display. The vector must be monotonically increasing and must have the same length as the input signal frame size.
Tunable: Yes
Dependency
To enable this property, set:
InputDomainto"Frequency".FrequencyVectorSourceto"Property".
Scope Window Use
Click the Estimation tab on the Spectrum Analyzer toolstrip. In the Domain section, set Frequency (Hz) to a monotonically increasing vector of length equal to the input signal frame size.
To enable the Frequency (Hz), set
Input Domain to
Frequency.
Data Types: single | double | int8 | int16 | int32 | int64 | uint8 | uint16 | uint32 | uint64
Units of the frequency-domain input, specified as
"dBm", "dBuV",
"dBV", "dBW",
"Vrms", "Watts", or
"none". This property allows the Spectrum
Analyzer to scale frequency data if you choose a different display unit
in the SpectrumUnits property.
Tunable: Yes
Dependency
To enable this property, set InputDomain to
"Frequency".
Scope Window Use
Click the Estimation tab on the Spectrum Analyzer toolstrip. In the Domain section, set Input Unit.
To enable the Input Unit, set Input
Domain to
Frequency.
Data Types: char | string
Units of the spectrum, specified as one of these:
"dBm""dBuV"(since R2023b)"dBFS""dBV""dBW""Vrms""Watts""dBm/Hz""dBW/Hz""dBFS/Hz""Watts/Hz""Auto"
The Spectrum Analyzer displays power values in the units you select in this property.
Tunable: Yes
Dependency
The available spectrum units depend on the value you specify in
the SpectrumType property.
InputDomain | SpectrumType | Allowed
SpectrumUnits |
|---|---|---|
"Time" | "Power" | "dBm",
"dBW",
"dBFS",
"Watts" |
"Power density" | "dBm/Hz",
"dBW/Hz","dBFS/Hz",
"Watts/Hz" | |
"RMS" | "dBV", "dBuV" (since R2023b),
"Vrms" | |
"Frequency" | ― | "Auto",
"dBm", "dBuV" (since R2023b),
"dBV",
"dBW",
"Vrms",
"Watts" |
If you set the InputDomain property to
"Frequency" and the
SpectrumUnits property to
"Auto", the Spectrum Analyzer assumes the
spectrum units to be equal to input units specified in the
InputUnits property. If you set
InputDomain to "Time"
and SpectrumUnits to any option other than
"Auto", then the Spectrum Analyzer converts
the units specified in InputUnits to the units
specified in SpectrumUnits.
Scope Window Use
Click the Spectrum tab on the Spectrum Analyzer toolstrip. In the Scale section, set Spectrum Unit.
Data Types: char | string
Source of dBFS scaling factor, specified as one of these:
"Auto"–– The Spectrum Analyzer adjusts the scaling factor based on the input data."Property"–– Specify the full-scale scaling factor using theFullScaleproperty.
Tunable: Yes
Dependency
To enable this property, set:
InputDomainto"Time"SpectrumTypeto"Power"or"Power density"SpectrumUnitsto"dBFS"or"dBFS/Hz"(when spectrum type is set to"Power density")
Scope Window Use
Click the Spectrum tab on the Spectrum
Analyzer toolstrip. In the Scale section, set
the Full Scale to either
Auto or a positive scalar.
To enable the Full Scale:
In the Scope tab, set the spectrum type to
PowerorPower Density.In the Estimation tab, set Input Domain to
Time.In the Spectrum tab, set Spectrum Unit to
dBFSordBFS/Hz(when spectrum type is set toPower Density).
Data Types: char | string
dBFS full scale value, specified as a character vector or a string scalar of a real positive scalar.
Tunable: Yes
Dependency
To enable this property, set:
InputDomainto"Time"SpectrumTypeto"Power"or"Power density"SpectrumUnitsto"dBFS"or"dBFS/Hz"(when spectrum type is set to"Power density")FullScaleSourceto"Property"
Scope Window Use
Click the Spectrum tab on the Spectrum
Analyzer toolstrip. In the Scale section, set
the Full Scale to either
Auto or enter a positive
scalar.
To enable the Full Scale:
In the Scope tab, set the spectrum type to
PowerorPower Density.In the Estimation tab, set Input Domain to
Time.In the Spectrum tab, set Spectrum Unit to
dBFSordBFS/Hz(when spectrum type is set toPower Density).
Data Types: char | string
Reference load to compute the power levels, specified as a character vector or a string scalar of a positive scalar in Ohms.
Tunable: Yes
Scope Window Use
Click the Spectrum tab on the Spectrum Analyzer toolstrip. In the Scale section, set Reference Load (Ω).
Data Types: char | string
Frequency offset, specified as one of these:
Numeric scalar — Apply the same frequency offset to all channels, specified as a character vector or a string scalar in Hz.
Numeric vector — Apply a specific frequency offset for each channel, specified as a character vector or a string scalar in Hz. The vector length must be equal to the number of input channels.
The frequency-axis values are offset by the values specified in this property. The overall span must fall within the Nyquist Frequency Interval. You can control the overall span in different ways based on how you set the
FrequencySpanproperty.
Tunable: Yes
Scope Window Use
Click the Scope tab on the Spectrum Analyzer toolstrip. In the Bandwidth section, set Offset (Hz).
Data Types: char | string
Option to treat unoriented input signal as a column vector, specified as
true or false. Set this property to
true to treat M-by-1 and unoriented inputs as
a column vector or one channel. Set this property to false to treat
M-by-1 and unoriented inputs as a 1-by-M row
vector.
Data Types: logical
Spectrogram
Channel for which the Spectrum Analyzer plots the spectrogram, specified as a character vector or string scalar of a positive scalar integer in the range [1 N], where N is the number of input channels.
Tunable: Yes
Dependency
To enable this property, set ViewType to
"Spectrogram" or "Spectrum and
spectrogram".
Scope Window Use
Click the Spectrogram tab on the Spectrum Analyzer toolstrip. In the Channel section, select a Channel.
Data Types: char | string
Source of the time resolution value of each spectrogram line, ,
specified as "Auto" or "Property".
The TimeResolution property shows the time
resolution for the different frequency resolution methods and time
resolution properties.
Tunable: Yes
Dependency
To enable this property, set:
InputDomainto"Time".ViewTypeto"Spectrogram"or"Spectrum and spectrogram".
Scope Window Use
Click the Spectrogram tab on the Spectrum
Analyzer toolstrip. In the Time Options
section, set the Time Resolution (s) to
Auto or enter a positive scalar.
To enable the Time Resolution (s), select
Spectrogram in the
Scope tab and set Input
Domain to Time in the
Estimation tab.
Data Types: char | string
Time resolution of each spectrogram line, specified as a character vector or a string scalar of a positive scalar and expressed in seconds.
The Spectrum Analyzer determines the time resolution value based on the frequency resolution method, RBW, and time resolution properties.
| Method | RBW | Time Resolution | Resulting Time Resolution in Seconds |
|---|---|---|---|
Welch or Filter
Bank | Auto | Auto | 1/RBW |
Welch or Filter
Bank | Auto | Manually entered | 1/Time Resolution Hz |
Welch or Filter
Bank | Manually entered | Auto | 1/RBW seconds |
Welch or Filter
Bank | Manually entered | Manually entered | Equal to or greater than the minimum attainable time resolution 1/RBW. The Spectrum Analyzer combines several spectral estimates into one spectrogram line to obtain the desired time resolution. It uses interpolation to obtain time resolution values that are not integer multiples of 1/RBW. |
Tunable: Yes
Dependency
To enable this property, set:
InputDomainto"Time".ViewTypeto"Spectrogram"or"Spectrum and spectrogram".TimeResolutionSourceto"Property.
Scope Window Use
Click the Spectrogram tab on the Spectrum
Analyzer toolstrip. In the Time Options
section, set the Time Resolution (s) to
Auto or enter a positive scalar.
To enable the Time Resolution (s), select
Spectrogram in the
Scope tab and set Input
Domain to Time in the
Estimation tab.
Data Types: char | string
Source of the time span of the spectrogram, specified as
"Auto" or "Property". If you
set this property to "Auto", the spectrogram displays
100 spectrogram lines at any given time. If you set this property to
"Property", the spectrogram uses the time
duration you specify in seconds in the TimeSpan
property.
Tunable: Yes
Dependency
To enable this property, set ViewType to
"Spectrogram" or "Spectrum and
spectrogram".
Scope Window Use
Click the Spectrogram tab on the Spectrum
Analyzer toolstrip. In the Time Options
section, set the Time Span (s) to
Auto or enter a positive scalar.
Data Types: char | string
Time span of the spectrogram display in seconds, specified as a character vector or string scalar of a positive scalar. You must set the time span to be at least twice as large as the duration of the number of samples required for a spectral update.
Tunable: Yes
Dependency
To enable this property, set:
ViewTypeto"Spectrogram"or"Spectrum and spectrogram".TimeSpanSourceto"Property".
Scope Window Use
Click the Spectrogram tab on the Spectrum
Analyzer toolstrip. In the Time Options
section, set the Time Span (s) to
Auto or enter a positive scalar.
Data Types: char | string
Measurements
Channel over which the measurements are obtained, specified as a character vector or a string scalar which evaluates to a positive integer less than or equal to 100. The highest number you can specify is equal to the number of channels (columns) in the input signal.
Tunable: Yes
Scope Window Use
Click the Measurements tab on the Spectrum Analyzer toolstrip. In the Channel section, select a Channel.
Data Types: char | string
Channel measurements, specified as a ChannelMeasurementsConfiguration object. Enable channel
measurements to compute and display the occupied bandwidth or adjacent
channel power ratio. All
ChannelMeasurementsConfiguration properties are
tunable.
Tunable: Yes
Dependency
To enable this property, set ViewType to
"Spectrum" or "Spectrum and
spectrogram".
Scope Window Use
Click the Channel Measurements tab on the Spectrum Analyzer toolstrip and modify the measurement settings.
The Channel Measurements tab appears when you select Spectrum in the Scope tab.
Cursor measurements, specified as a CursorMeasurementsConfiguration
object. Enable cursor measurements to display waveform cursors. All
CursorMeasurementsConfiguration properties are
tunable.
Tunable: Yes
Dependency
To enable this property, set ViewType to "Spectrum" or
"Spectrum and
                                    spectrogram"
.
Scope Window Use
Click the Measurements tab on the Spectrum Analyzer toolstrip and modify the cursor measurements in the Cursors section.
The Measurements tab appears when you select Spectrum in the Scope tab.
Distortion measurements, specified as a DistortionMeasurementsConfiguration object. Enable distortion measurements
to compute and display the harmonic distortion and intermodulation distortion. All
DistortionMeasurementsConfiguration properties are tunable.
Tunable: Yes
Dependency
To enable this property, set ViewType to "Spectrum" or
"Spectrum and
                                            spectrogram"
.
Scope Window Use
Click the Measurements tab on the Spectrum Analyzer toolstrip and modify the distortion measurements in the Distortion section.
The Measurements tab appears when you select Spectrum in the Scope tab.
Peak finder measurement, specified as a PeakFinderConfiguration object. Enable peak finder to compute and display
the largest calculated peak values. All PeakFinderConfiguration
properties are tunable.
Tunable: Yes
Dependency
To enable this property, set ViewType to
"Spectrum" or "Spectrum and
spectrogram".
Scope Window Use
Click the Measurements tab on the Spectrum Analyzer toolstrip and modify the peak finder measurements in the Peaks section.
The Measurements tab appears when you select Spectrum in the Scope tab.
Since R2025a
Phase noise measurements, specified as a PhaseNoiseConfiguration object. Enable the
PhaseNoise property to measure the phase noise
of the signal and plot it against the specified target phase noise
profile. All PhaseNoiseConfiguration properties are
tunable.
Note
To measure the phase noise, you must have a valid Mixed-Signal Blockset™ license.
Tunable: Yes
Scope Window Use
Click the Measurements tab on the spectrum analyzer toolstrip and modify the phase noise measurement settings in the Phase Noise section.
Spectral mask configuration, specified as a SpectralMaskConfiguration object. Use the spectral mask
configuration to draw upper, lower, or upper and lower mask lines in the
power and power-density plots. All
SpectralMaskConfiguration properties are
tunable.
Tunable: Yes
Dependency
To enable this property, set:
ViewTypeto"Spectrum"or"Spectrum and spectrogram".SpectrumTypeto either"Power"or"Power density".
Scope Window Use
Click the Spectral Mask tab on the Spectrum Analyzer toolstrip and modify the settings.
The Spectral Mask tab appears when you:
Select Spectrum in the Scope tab.
In the drop-down list under Spectrum, choose either
PowerorPower Density.
Visualization
Caption to display in the scope window, specified as a character vector or string scalar.
Tunable: Yes
Data Types: char | string
Spectrum Analyzer window position in pixels, specified by the size and location of the scope window as a four-element double vector of the form [left bottom width height]. You can place the scope window in a specific position on your screen by modifying the values to this property.
By default, the window appears in the center of your screen with a width of 800 pixels and height
of 450 pixels. The exact center coordinates depend on your screen resolution.
Tunable: Yes
Maximize axes control, specified as one of the following:
"Auto"–– The Spectrum Analyzer maximizes axes only if the display does not contain any labels or title annotations."On"–– The Spectrum Analyzer maximizes axes in all displays."Off"–– The Spectrum Analyzer does not maximize axes in any display.
Scope Window Use
Click the ![]() control on the Spectrum Analyzer display to
maximize the axes.
control on the Spectrum Analyzer display to
maximize the axes.
Tunable: Yes
Data Types: char | string
Normal trace flag, specified as true or
false.
To remove normal traces from the display, set this property to
false. These traces display the free-running
spectral estimates. The Spectrum Analyzer continues its spectral
computations even when you set this property to
false.
Tunable: Yes
Dependency
To enable this property, set ViewType to
"Spectrum" or "Spectrum and
spectrogram".
Scope Window Use
Click the Spectrum tab on the Spectrum Analyzer toolstrip and select the Normal Trace check box in the Trace Options section.
To enable the Normal Trace check box, select Spectrum in the Scope tab.
Data Types: logical
Maximum-hold trace flag, specified as false or
true.
To compute and plot the maximum-hold spectrum of each input channel,
set this property to true. The Spectrum Analyzer
computes the maximum-hold spectrum at each frequency bin by keeping the
maximum value of all the power spectrum estimates. When you toggle this
property, the Spectrum Analyzer resets its maximum-hold
computations.
Tunable: Yes
Dependency
To enable this property, set ViewType to
"Spectrum" or "Spectrum and
spectrogram".
Scope Window Use
Click the Spectrum tab on the Spectrum Analyzer toolstrip and select the Max-Hold Trace check box in the Trace Options section.
To enable the Max-Hold Trace check box, select Spectrum in the Scope tab.
Data Types: logical
Minimum-hold trace flag, specified as false or
true.
To compute and plot the minimum-hold spectrum of each input channel,
set this property to true. The Spectrum Analyzer
computes the minimum-hold spectrum at each frequency bin by keeping the
minimum value of all the power spectrum estimates. When you toggle this
property, the Spectrum Analyzer resets its minimum-hold
computations.
Tunable: Yes
Dependency
To enable this property, set ViewType to
"Spectrum" or "Spectrum and
spectrogram".
Scope Window Use
Click the Spectrum tab on the Spectrum Analyzer toolstrip and select the Min-Hold Trace check box in the Trace Options section.
To enable the Min-Hold Trace check box, select Spectrum in the Scope tab.
Data Types: logical
Display title, specified as a character vector or a string scalar.
Tunable: Yes
Scope Window Use
Click the Scope tab on the spectrum analyzer toolstrip. In the Configuration section, click Settings, and enter Title.
Data Types: char | string
y-axis label, specified as a character vector or a string scalar. The Spectrum Analyzer displays the label to the left of the y-axis.
Regardless of the value of this property, Spectrum Analyzer always displays power
units as one of the SpectrumUnits values.
Tunable: Yes
Dependency
To enable this property, set ViewType to
"Spectrum" or "Spectrum and
spectrogram".
Scope Window Use
Click the Scope tab on the Spectrum Analyzer toolstrip. In the Configuration section, click Settings. In the Spectrum Analyzer Settings window that opens up, under Display and labels, enter Y-Label.
To enable the Y-Label, select Spectrum in the Scope tab.
Data Types: char | string
y-axis limits, specified as a two-element numeric vector of the
form [ymin ymax]. The units of the y-axis limits
depend on the SpectrumUnits property.
Example: scope.YLimits = [-10,20]
Tunable: Yes
Dependencies
To enable this property, set the
ViewTypeproperty to"Spectrum"or"Spectrum and spectrogram".The units directly depend upon the
SpectrumUnitsproperty.
Scope Window Use
Click the Scope tab on the Spectrum Analyzer toolstrip. In the Configuration section, click Settings. In the Spectrum Analyzer Settings window that opens up, under Display and Labels, enter Y-Limits.
To enable the Y-Limits, select Spectrum in the Scope tab.
Color limits of the spectrogram, specified as a two-element numeric
vector of the form [colorMin colorMax]. The units of
the color limits directly depend upon the
SpectrumUnits property.
Example: scope.ColorLimits = [-10,20]
Tunable: Yes
Dependencies
To enable this property, set the
ViewTypeproperty to"Spectrogram"or"Spectrum and spectrogram".The units directly depend upon the
SpectrumUnitsproperty.
Scope Window Use
Click the Scope tab on the Spectrum Analyzer toolstrip. In the Configuration section, click Settings. In the Spectrum Analyzer Settings window that opens up, under Display and Labels, enter Color Limits.
To enable the Color Limits, select Spectrogram in the Scope tab.
Color lookup table, specified as a valid colormap name or a three-column matrix with values in the range [0,1] defining RGB triplets.
Tunable: Yes
Dependencies
To enable this property, set the ViewType
property to "Spectrogram" or "Spectrum
and spectrogram".
Scope Window Use
Click the Scope tab on the Spectrum Analyzer toolstrip. In the Configuration section, click Settings. In the Spectrum Analyzer Settings window that opens up, under Display and Labels, enter Color Map.
To enable the Color Map, select Spectrogram in the Scope tab.
Data Types: double | char | string
Flag to show the grid, specified as true or
false. Set this property to true to show grid
lines in the plot.
Tunable: Yes
Scope Window Use
Click the Scope tab on the Spectrum Analyzer toolstrip. In the Configuration section, click Settings, and select Show Grid.
Data Types: logical
Channel names in the input data, specified as a cell array of character vectors or an array of strings. The names you specify in this property appear in the following locations:
Legend
Spectrum Analyzer Settings > Color and styling section
Measurements and Channel Measurements tabs
If you do not specify channel names, the
spectrum analyzer names the channels as Channel 1, Channel
2, and so on.
Tunable: Yes
Dependency
To see the channel names, set ShowLegend to
true.
Scope Window Use
Click the Scope tab on the spectrum analyzer toolstrip. To see the legend, click Legend in the Configuration section.
Data Types: char
Flag to show the legend, specified as true or
false. To show a legend with the input names, set this property
to true.
Use the legend to control which signals are visible. In the scope legend, click a signal name to hide the signal in the scope. To show the signal, click the signal name again. To show only one signal, right-click the signal name. To show all signals, press Esc.
Tunable: Yes
Dependencies
To enable this property, set the ViewType property to
"Spectrum" or "Spectrum and spectrogram".
Scope Window Use
Click the Scope tab on the Spectrum Analyzer toolstrip. To see the legend, click Legend in the Configuration section.
To enable the Legend, select Spectrum in the Scope tab.
Data Types: logical
Flag to show the color bar, specified as true or
false.
Tunable: Yes
Dependencies
To enable this property, set the ViewType
property to "Spectrogram" or "Spectrum
and spectrogram".
Scope Window Use
Click the Scope tab on the Spectrum Analyzer toolstrip. To see the color bar, click Colorbar in the Configuration section.
To enable the Colorbar, select Spectrogram in the Scope tab.
Data Types: logical
Layout of the axes, specified as one of "Vertical"
or "Horizontal". A vertical layout stacks the
spectrum above the spectrogram. A horizontal layout places the spectrum
next to the spectrogram.
Tunable: Yes
Dependency
To enable this property, set ViewType to
"Spectrum and
                                            spectrogram"
.
Scope Window Use
Click the Scope tab on the Spectrum Analyzer toolstrip. Select Spectrum and Spectrogram. In the Configuration section, select and update Layout.
Data Types: char | string
Flag to open scope when simulation starts, specified as true or
false.
Set this property to true to open the scope when the simulation starts.
Set this property to false to prevent the scope from opening when you
simulate the model.
Scope Window Use
Click Settings in the Scope tab. In the Spectrum Analyzer Settings window that opens, select Open at Simulation Start.
Data Types: logical
Set this property to true to display the spectrum analyzer window, and to
false to hide the spectrum analyzer window.
Data Types: logical
Examples
Create a new Simulink® model with a randomly generated name.
sysname=char(randi(26,1,7)+96);
new_system(sysname);
Add a new Spectrum Analyzer block to the model.
add_block('built-in/SpectrumAnalyzer',[sysname,'/SpectrumAnalyzer'])
Call the get_param function to retrieve the default Spectrum Analyzer block configuration properties.
config = get_param([sysname,'/SpectrumAnalyzer'],'ScopeConfiguration')
config =
  SpectrumAnalyzerBlockConfiguration with properties:

                   NumInputPorts: '1'
                     InputDomain: 'Time'
                    SpectrumType: 'Power'
                        ViewType: 'Spectrum'
                SampleRateSource: 'Inherited'
                          Method: 'Filter bank'
          PlotAsTwoSidedSpectrum: 1
                  FrequencyScale: 'Linear'
                        PlotType: 'Line'
                     AxesScaling: 'Auto'

   Advanced
       FrequencyResolutionMethod: 'RBW'
                       RBWSource: 'Auto'
                 FilterSharpness: '0.3'
                   FrequencySpan: 'Full'
                 AveragingMethod: 'VBW'
                       VBWSource: 'Auto'
                   SpectrumUnits: 'dBm'
                   ReferenceLoad: '1'
                 FrequencyOffset: '0'
    TreatMby1SignalsAsOneChannel: 1

   Spectrogram
    No properties.

   Measurements
              MeasurementChannel: '1'
             ChannelMeasurements: [1×1 ChannelMeasurementsConfiguration]
              CursorMeasurements: [1×1 CursorMeasurementsConfiguration]
          DistortionMeasurements: [1×1 DistortionMeasurementsConfiguration]
                      PeakFinder: [1×1 PeakFinderConfiguration]
                      PhaseNoise: [1×1 PhaseNoiseConfiguration]
                    SpectralMask: [1×1 SpectralMaskConfiguration]

   Visualization
                            Name: 'SpectrumAnalyzer'
                        Position: [214.4000 241.5200 800 500]
                    MaximizeAxes: 'Auto'
                 PlotNormalTrace: 1
                PlotMaxHoldTrace: 0
                PlotMinHoldTrace: 0
                           Title: ''
                          YLabel: ''
                         YLimits: [-80 20]
                        ShowGrid: 1
                    ChannelNames: {''}
                      ShowLegend: 0
           OpenAtSimulationStart: 1
                         Visible: 0
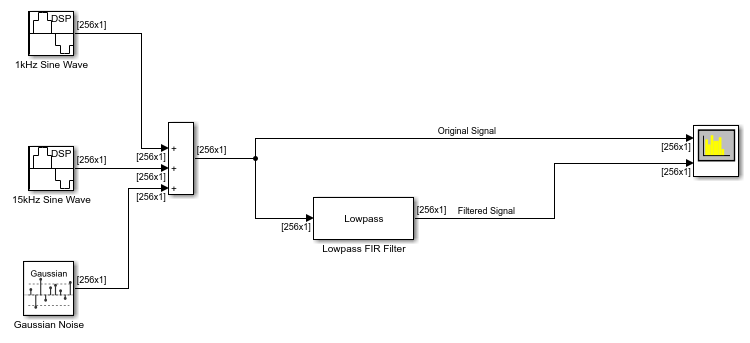
Compute and display the power spectrum of a noisy sinusoidal input signal using the Spectrum Analyzer block. Measure the cursor placements, adjacent channel power ratio, distortion, and peak values in the spectrum by enabling these block configuration properties:
CursorMeasurementsChannelMeasurementsDistortionMeasurementsPeakFinder
Open and Inspect the Model
Filter a streaming noisy sinusoidal input signal using a Lowpass Filter block. The input signal consists of two sinusoidal tones: 1 kHz and 15 kHz. The noise is white Gaussian noise with a mean of 0 and a variance of 0.05. The sampling frequency is 44.1 kHz. Open the model and inspect the parameter values in the blocks.
model = 'spectrumanalyzer_measurements.slx';
open_system(model)
Access the configuration properties of the Spectrum Analyzer block using the get_param function.
sablock = 'spectrumanalyzer_measurements/Spectrum Analyzer';
cfg = get_param(sablock,'ScopeConfiguration');
Enable Measurements Data
To obtain the measurements, set the Enabled property to true. Label the peak measurements.
cfg.CursorMeasurements.Enabled = true;
cfg.ChannelMeasurements.Enabled = true;
cfg.DistortionMeasurements.Enabled = true;
cfg.PeakFinder.Enabled = true;
cfg.PeakFinder.LabelPeaks = true;
Simulate the Model
Run the model. The Spectrum Analyzer block compares the original spectrum with the filtered spectrum.
sim(model)
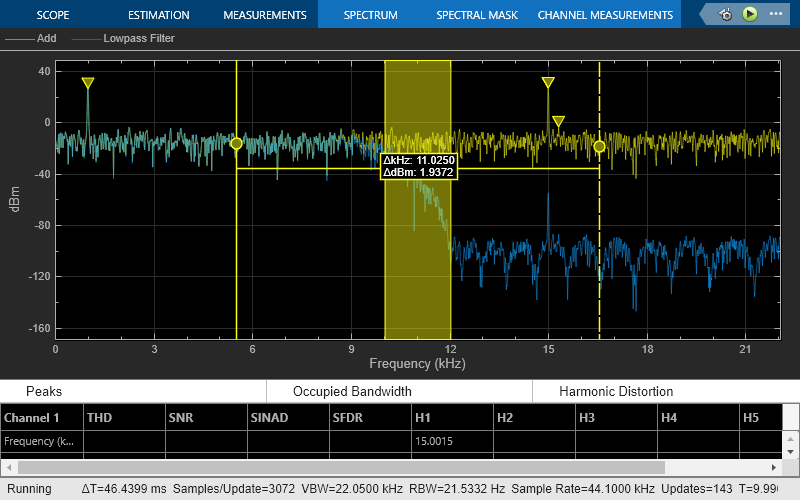
The panels at the bottom of the spectrum analyzer window display the measurements that you have enabled.
Use getMeasurementsData function
Use the getMeasurementsData function to obtain the measurements programmatically.
data = getMeasurementsData(cfg)
data =

  1×5 table

    SimulationTime    PeakFinder    CursorMeasurements    ChannelMeasurements    DistortionMeasurements
    ______________    __________    __________________    ___________________    ______________________

     {[99.9967]}      1×1 struct        1×1 struct            1×1 struct               1×1 struct
The values shown in the measurement panels match the values shown in data. You can access the individual fields of data to obtain the various measurements programmatically.
Compare Peak Values
As an example, compare the peak values. Verify that the peak values obtained by data.PeakFinder match with the values in the spectrum analyzer window.
peakvalues = data.PeakFinder.Value
frequencieskHz = data.PeakFinder.Frequency/1000
peakvalues =

   26.9429
   26.3691
   -4.7536


frequencieskHz =

   15.0015
    1.0049
    0.7178
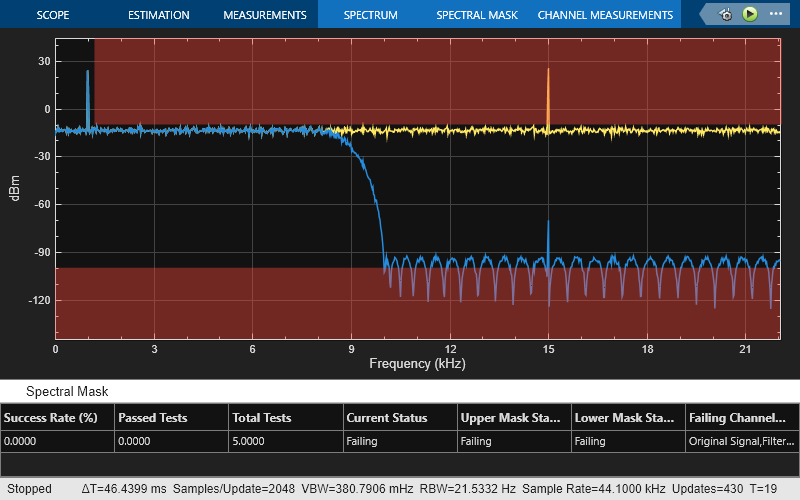
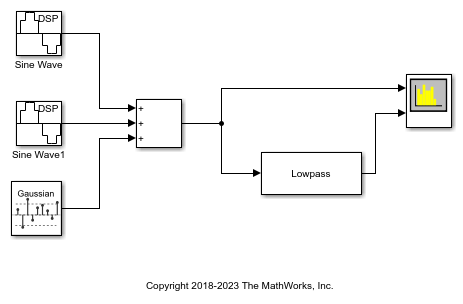
Create a new model based on the dsp_basic_filter template. Add a spectral mask to the Spectrum Analyzer block in the model. Run the model.
Masks are overlaid on the spectrum. If the mask is green, the signal is passing. If the mask is red, the signal is failing. The Spectral Mask panel shows what percentage of the time the mask is succeeding, which mask is failing, how many times the mask(s) failed, and which channels are causing the failure.
  [~,mdl] = fileparts(tempname);
  open_system(new_system(mdl,'FromTemplate','dsp_basic_filter'));
  saBlock = find_system(mdl,'BlockType','SpectrumAnalyzer');

  scopeConfig = get_param(saBlock{1},'ScopeConfiguration');
  upperMask = [0 50; 1200 50; 1200 -10; 24000 -10];
  scopeConfig.SpectralMask.UpperMask = upperMask;
  scopeConfig.SpectralMask.LowerMask = -100;
  scopeConfig.SpectralMask.EnabledMasks = 'upper-and-lower';
  sim(mdl,StopTime='20');