CursorMeasurementsConfiguration
Measure signal values using vertical waveform cursors that track along the signal
Since R2022a
Description
Use the CursorMeasurementsConfiguration object to enable waveform
cursors. You can control the cursor settings from the toolstrip of the scope or from the
command line.
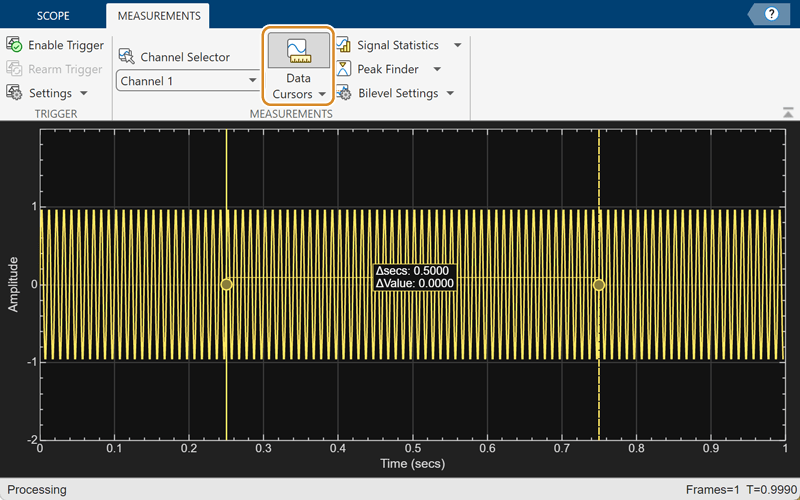
To display vertical cursors on each signal and to modify the cursor settings in the scope UI, click the Measurements tab and enable Data Cursors. Each cursor tracks a vertical line along the signal. The scope displays the difference between x- and y-values of the signal at the two cursors in the box between the cursors. The cursors appear only when the scope has at least one signal in its display. You can use the mouse to move the vertical cursors left and right.
Spectrum Analyzer Toolstrip
Time Scope Toolstrip
Array Plot Toolstrip
Dynamic Filter Visualizer Toolstrip

Creation
Description
cursormeas = CursorMeasurementsConfiguration() creates a cursor
measurements configuration object.
Properties
Examples
Create a sine wave and view it in the Time Scope. Enable data cursors programmatically.
The timescope object requires one of these products:
DSP System Toolbox™
Navigation Toolbox™
Sensor Fusion and Tracking Toolbox™
Initialization
Create the input sine wave using the sin function. Create a timescope MATLAB® object to display the signal. Set the TimeSpan property to 1 second.
f = 100;
fs = 1000;
swv = sin(2.*pi.*f.*(0:1/fs:1-1/fs)).';
scope = timescope(SampleRate=fs,...
    TimeSpanSource="property",...
    TimeSpan=1);
Enable Data Cursors
Enable data cursors in the scope programmatically by setting the Enabled property of the CursorMeasurementsConfiguration object to true.
scope.CursorMeasurements.Enabled = true;
scope(swv);

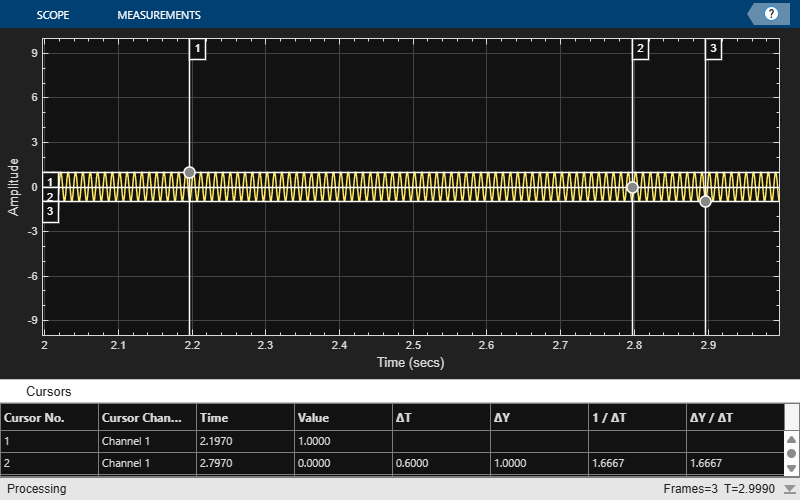
Specify Multiple Data Cursors
Specify XLocation to [0.2 0.8 0.9]. The scope shows waveform cursors at these locations.
scope.CursorMeasurements.XLocation = [0.2 0.8 0.9]
scope =
  timescope handle with properties:

               SampleRate: 1000
           TimeSpanSource: 'property'
                 TimeSpan: 1
    TimeSpanOverrunAction: 'scroll'
              AxesScaling: 'onceatstop'

  Show all properties
scope(swv)
If you specify LinkToWaveform as false, the scope shows screen cursors based on the XLocation and YLocation values you specify.
scope.CursorMeasurements.LinkToWaveform = false;
scope.CursorMeasurements.YLocation = [1 0 -1];
scope(swv)
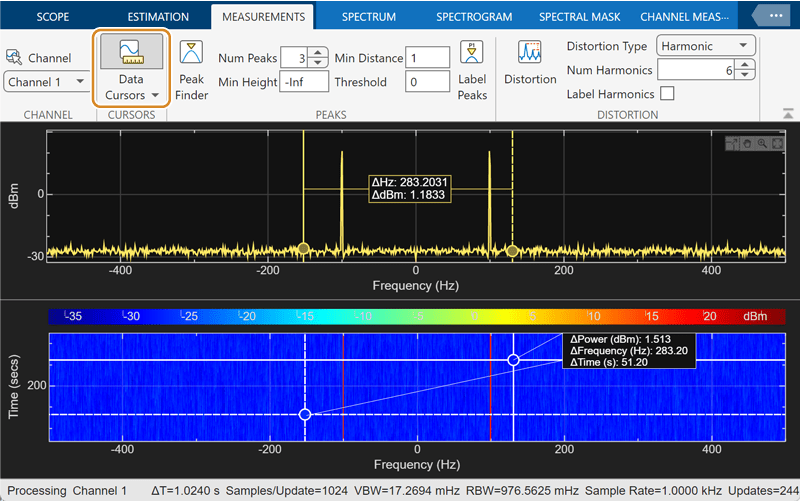
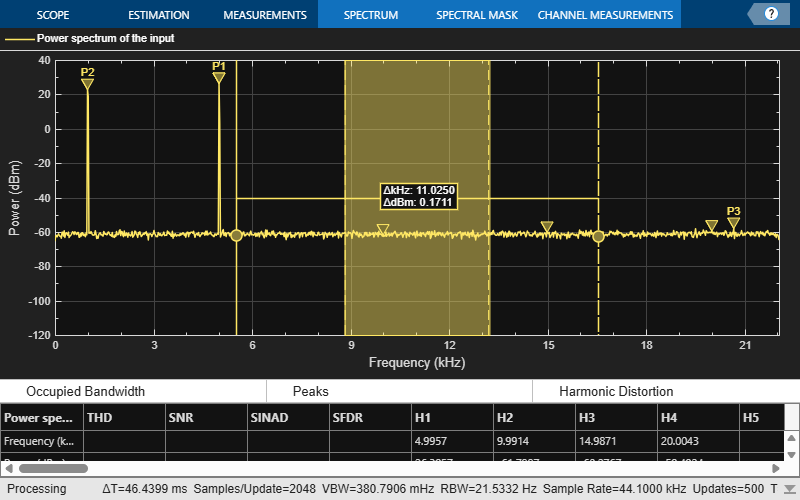
Compute and display the power spectrum of a noisy sinusoidal input signal using the spectrumAnalyzer object. Measure the peaks, cursor placements, adjacent channel power ratio, and distortion values in the spectrum by enabling these properties:
PeakFinderCursorMeasurementsChannelMeasurementsDistortionMeasurements
Initialization
The input sine wave has two frequencies: 1000 Hz and 5000 Hz. Create two dsp.SineWave System objects to generate these two frequencies. Create a spectrumAnalyzer object to compute and display the power spectrum.
Fs = 44100;
Sineobject1 = dsp.SineWave(SamplesPerFrame=1024,PhaseOffset=10,...
    SampleRate=Fs,Frequency=1000);
Sineobject2 = dsp.SineWave(SamplesPerFrame=1024,...
    SampleRate=Fs,Frequency=5000);
SA = spectrumAnalyzer(SampleRate=Fs,SpectrumType="power",...
    PlotAsTwoSidedSpectrum=false,ChannelNames={'Power spectrum of the input'},...
    YLimits=[-120 40],ShowLegend=true);
Enable Measurements Data
To obtain the measurements, set the Enabled property to true. Label the peak measurements.
SA.CursorMeasurements.Enabled = true;
SA.ChannelMeasurements.Enabled = true;
SA.PeakFinder.Enabled = true;
SA.PeakFinder.LabelPeaks = true;
SA.DistortionMeasurements.Enabled = true;
Use getMeasurementsData
Stream in the noisy sine wave input signal and estimate the power spectrum of the signal using the spectrumAnalyzer object. Measure the characteristics of the spectrum. Use the getMeasurementsData function to obtain these measurements programmatically. The isNewDataReady function returns true when there is new spectrum data. Store the measured data in the variable data.
data = [];
for Iter = 1:1000
    Sinewave1 = Sineobject1();
    Sinewave2 = Sineobject2();
    Input = Sinewave1 + Sinewave2;
    NoisyInput = Input + 0.001*randn(1024,1);
    SA(NoisyInput);
     if SA.isNewDataReady
        data = [data;getMeasurementsData(SA)];
     end
end
The panels at the bottom of the scope window display the measurements that you have enabled. The values in these panes match the values in the last time step of the data variable. You can access the individual fields of data to obtain the various measurements programmatically.
Compare Peak Values
Use the PeakFinder property to obtain peak values. Verify that the peak values in the last time step of data match the values in the spectrum analyzer plot.
peakvalues = data.PeakFinder(end).Value
peakvalues = 3×1

   26.3957
   22.7830
  -57.9977
frequencieskHz = data.PeakFinder(end).Frequency/1000
frequencieskHz = 3×1

    4.9957
    0.9905
   20.6719
Compute and display the power spectrum of a noisy sinusoidal input signal using the Spectrum Analyzer block. Measure the cursor placements, adjacent channel power ratio, distortion, and peak values in the spectrum by enabling these block configuration properties:
CursorMeasurementsChannelMeasurementsDistortionMeasurementsPeakFinder
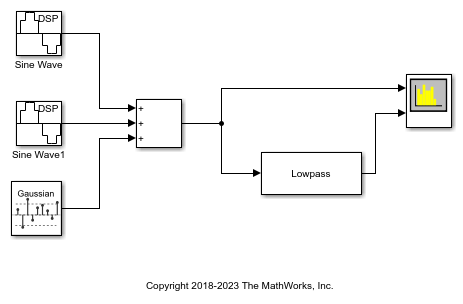
Open and Inspect the Model
Filter a streaming noisy sinusoidal input signal using a Lowpass Filter block. The input signal consists of two sinusoidal tones: 1 kHz and 15 kHz. The noise is white Gaussian noise with a mean of 0 and a variance of 0.05. The sampling frequency is 44.1 kHz. Open the model and inspect the parameter values in the blocks.
model = 'spectrumanalyzer_measurements.slx';
open_system(model)
Access the configuration properties of the Spectrum Analyzer block using the get_param function.
sablock = 'spectrumanalyzer_measurements/Spectrum Analyzer';
cfg = get_param(sablock,'ScopeConfiguration');
Enable Measurements Data
To obtain the measurements, set the Enabled property to true. Label the peak measurements.
cfg.CursorMeasurements.Enabled = true;
cfg.ChannelMeasurements.Enabled = true;
cfg.DistortionMeasurements.Enabled = true;
cfg.PeakFinder.Enabled = true;
cfg.PeakFinder.LabelPeaks = true;
Simulate the Model
Run the model. The Spectrum Analyzer block compares the original spectrum with the filtered spectrum.
sim(model)
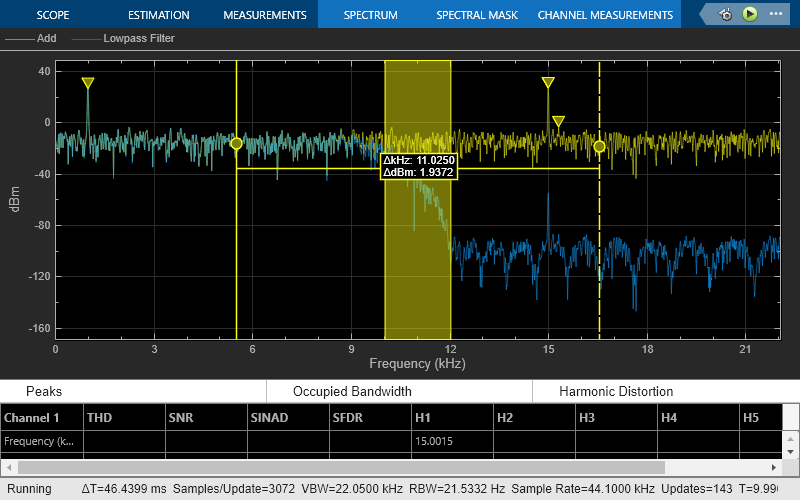
The panels at the bottom of the spectrum analyzer window display the measurements that you have enabled.
Use getMeasurementsData function
Use the getMeasurementsData function to obtain the measurements programmatically.
data = getMeasurementsData(cfg)
data =

  1×5 table

    SimulationTime    PeakFinder    CursorMeasurements    ChannelMeasurements    DistortionMeasurements
    ______________    __________    __________________    ___________________    ______________________

     {[99.9967]}      1×1 struct        1×1 struct            1×1 struct               1×1 struct
The values shown in the measurement panels match the values shown in data. You can access the individual fields of data to obtain the various measurements programmatically.
Compare Peak Values
As an example, compare the peak values. Verify that the peak values obtained by data.PeakFinder match with the values in the spectrum analyzer window.
peakvalues = data.PeakFinder.Value
frequencieskHz = data.PeakFinder.Frequency/1000
peakvalues =

   26.9429
   26.3691
   -4.7536


frequencieskHz =

   15.0015
    1.0049
    0.7178