Pull up a chair!
Discussions is your place to get to know your peers, tackle the bigger challenges together, and have fun along the way.
- Want to see the latest updates? Follow the Highlights!
- Looking for techniques improve your MATLAB or Simulink skills? Tips & Tricks has you covered!
- Sharing the perfect math joke, pun, or meme? Look no further than Fun!
- Think there's a channel we need? Tell us more in Ideas
Updated Discussions
I submitted a Matlab support case but posting this publicly to hopefully save people some trouble and see if anyone has ideas.
After upgrading my workstation from Ubuntu 25.10 to Ubuntu 26.04 LTS, MATLAB GUI consistently prints this terminal error on shutdown:
free(): chunks in smallbin corrupted
MATLAB appears to run normally, but closing the GUI takes a long time and sometimes produces crash dumps. The terminal error occurs every time I close the GUI, but crash dumps are intermittent. I attached one R2026a crash dump. I had zero issues on Ubuntu 25.10.
Affected versions:
- MATLAB R2026a
- MATLAB R2025b
- I suspect any 'new desktop' version
System:
- Ubuntu 26.04 LTS
- AMD EPYC 7443P
- NVIDIA RTX 3090
- Ubuntu 26.04 default NVIDIA driver: nvidia-driver-595-open, 595.58.03
- NVIDIA module path: /lib/modules/7.0.0-14-generic/kernel/nvidia-595-open/nvidia.ko
- glibc 2.43
Important note: the error first occurred with a clean MathWorks MATLAB installation before installing the Ubuntu/Debian `matlab-support` package. I later tested after installing `matlab-support`, which I understand modifies/renames some MATLAB-bundled libraries so MATLAB uses selected system libraries instead. The same shutdown error occurs both before and after applying `matlab-support`. This suggests the issue is not caused solely by the Debian/Ubuntu `matlab-support` integration or solely by one of the libraries it substitutes.
The attached crash dump shows abort/free() heap corruption detected in libc, but the higher-level stack includes MATLAB libraries such as:
- libmwcppmicroservices.so
- libmwmodule_descriptor_implementation.so
- libmwmatlab_main_lib.so
- libmwfoundation_threadpool.so
The issue appears GUI-specific. Using these startup flags shut down cleanly:
- matlab -batch
- matlab -nodesktop
- matlab -nodisplay
The shutdown error still occurs with these startup flags:
- normal GUI launch
- -nosplash
- -nojvm
- -softwareopengl
- -cefdisablegpu
The issue also persists after:
- renaming/resetting ~/.matlab/R2026a and ~/.MathWorks/R2026a
- launching with a clean environment without LD_LIBRARY_PATH, LD_PRELOAD, MATLAB_JAVA, JAVA_HOME, JRE_HOME, etc.
- testing a new Ubuntu user account
- testing Ubuntu/GNOME, GNOME, and Xfce X11 sessions
- testing NO_AT_BRIDGE=1 and GTK_USE_PORTAL=0
- temporarily moving ~/.MathWorks/ServiceHost
- testing GLIBC_TUNABLES=glibc.malloc.tcache_count=0
- trying to capture a system coredump with ulimit -c unlimited / coredumpctl; no system coredump was produced
Because R2025b and R2026a are both affected, terminal-only modes exit cleanly, the problem occurs across GNOME/Wayland and Xfce/X11, and the error occurred on a clean MATLAB install before any `matlab-support` modifications, this appears related to MATLAB GUI shutdown on Ubuntu 26.04 / glibc 2.43 rather than a corrupted MATLAB preference folder, a single desktop session, or the Ubuntu `matlab-support` package.
Example crash dump:
I've talked about running local Large Language Models a couple of times on The MATLAB Blog but always had to settle for small models because of the tiny amount of memory on my GPU -- 6GB to be precise! Running much larger, more capable models meant requireing expensive, sever-class GPUs on HPC or cloud instances and I never had enough budget to do it.
Until now!
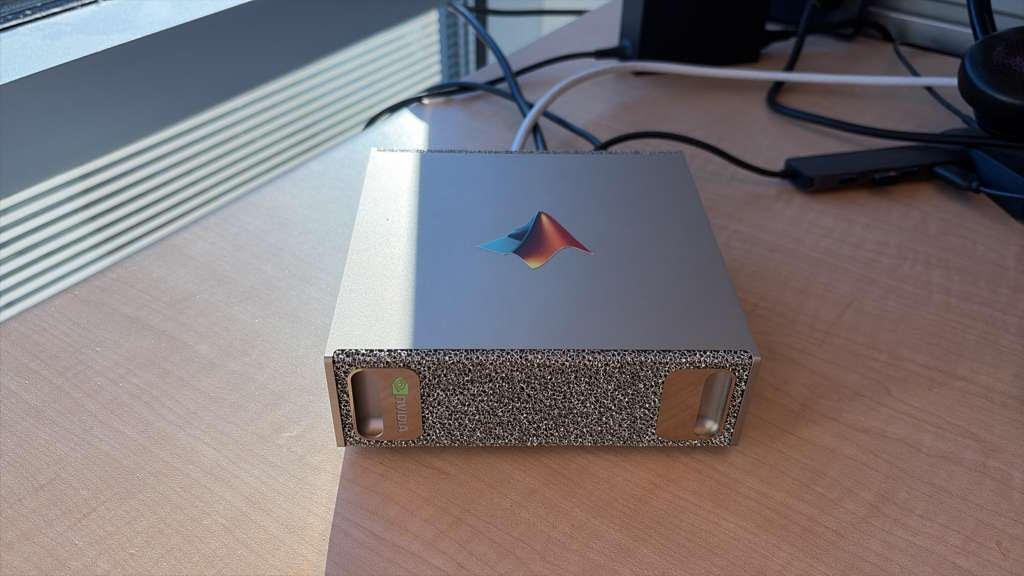
NVIDIA's DGX Spark is a small desktop machine that doesn't cost the earth. Indeed, several of us at MathWorks have one now although 'mine' (pictured above sporting a MATLAB sticker) is actually shared with a few other people and lives on a desk in Natick, USA while I'm in the UK.
The DGX Spark has 128GB of memory available to the GPU which means that I can run a MUCH larger language model. So, I installed a 120 Billion parameter model on it: gpt-oss:120b. More than an order of magnitude bigger than any local model I had played with before.
The next step was to connect to it from MATLAB running on my laptop.
The result is a *completely private* MATLAB + AI workflow that several of us have been playing with.
In my latest article, I show you how to set everything up: The LLM running on the DGX Spark connected to MATLAB running on my MacBook Pro. https://blogs.mathworks.com/matlab/2026/01/05/running-large-language-models-on-the-nvidia-dgx-spark-and-connecting-to-them-in-matlab/
PLEASE, PLEASE, PLEASE... make MATLAB Copilot available as an option with a home license.
🚀 Unlock Smarter Control Design with AI
What if AI could help you design better controllers—faster and with confidence?
In this session, Naren Srivaths Raman and Arkadiy Turevskiy (MathWorks) show how control engineers are using MATLAB and Simulink to integrate AI into real-world control design and implementation.
You’ll see how AI is being applied to:
🧠 Advanced plant modeling using nonlinear system identification and reduced order modeling
📡 Virtual sensors and anomaly detection to estimate hard-to-measure signals
🎯 Datadriven control design, including nonlinear MPC with neural statespace models and reinforcement learning
⚡ Productivity gains with generative AI, powered by MATLAB Copilot
Short version: MathWorks have released the MATLAB Agentic Toolkit which will significantly improve the life of anyone who is using MATLAB and Simulink with agentic AI systems such as Claude Code or OpenAI Codex. Go and get it from here: https://github.com/matlab/matlab-agentic-toolkit
Long version: On The MATLAB Blog Introducing the MATLAB Agentic Toolkit » The MATLAB Blog - MATLAB & Simulink
I have been a loyal MATLAB user for 25 years, starting from my university days. While many of my peers migrated to Python, I stayed for the stability, compatibility, and clean environment. However, I am finding the 2025 version exceptionally laggy. Despite running it on an $10k high-end machine, simple tasks like viewing variables and plotting take up to 60 seconds - actions that were near instantaneous in the 2020 version. I want to stay continue with MATLAB, but this performance gap is a major hurdle and irritation. I hope these optimization issues can be addressed quickly.
Hi,
I am trying to use an esp32 board with quectal ec200u LTE Modem to send sensor data to thingspeak. The board can process the sensor data however I am unable to send the data to thingspeak. I have used the same process earlier too however with a different modem from Simcom.
Can someone help me with specific commands for achieving this? I can share the code which i am trying to use.
Regards
Aditya
Hi everyone
My blog post about the latest MATLAB release was published yesterday MATLAB R2026a has been released – What’s new? » The MATLAB Blog - MATLAB & Simulink
There are a lot of new features and performance enhancements and from conversations I've had across several social media platforms., it seems that the new metafunction functionality is emerging as a user favourite. What are you most excited to see?
Cheers,
Mike
Overview
Authors:
- Narayanaswamy P.R. Iyer
- Provides Simulink models for various PWM techniques used for inverters
- Presents vector and direct torque control of inverter-fed AC drives and fuzzy logic control of converter-fed AC drives
- Includes examples, case studies, source codes of models, and model projects from all the chapters.
About this book
Successful development of power electronic converters and converter-fed electric drives involves system modeling, analyzing the output voltage, current, electromagnetic torque, and machine speed, and making necessary design changes before hardware implementation. Inverters and AC Drives: Control, Modeling, and Simulation Using Simulink offers readers Simulink models for single, multi-triangle carrier, selective harmonic elimination, and space vector PWM techniques for three-phase two-level, multi-level (including modular multi-level), Z-source, Quasi Z-source, switched inductor, switched capacitor and diode assisted extended boost inverters, six-step inverter-fed permanent magnet synchronous motor (PMSM), brushless DC motor (BLDCM) and induction motor (IM) drives, vector-controlled PMSM, IM drives, direct torque-controlled inverter-fed IM drives, and fuzzy logic controlled converter-fed AC drives with several examples and case studies. Appendices in the book include source codes for all relevant models, model projects, and answers to selected model projects from all chapters.
This textbook will be a valuable resource for upper-level undergraduate and graduate students in electrical and electronics engineering, power electronics, and AC drives. It is also a hands-on reference for practicing engineers and researchers in these areas.
Good morning everyone. I’m having a problem with ThingSpeak. I’m sending data from an ESP LoRa with the RTC set to the Brasília time zone (GMT-3).
Previously, when I exported the data to CSV, it used the ThingSpeak time, which appeared 3 hours ahead. Now that I’m sending the timestamp from the ESP, the graphs are showing the data 3 hours behind. Is there a way to align the graph times while keeping the Brazilian time zone?
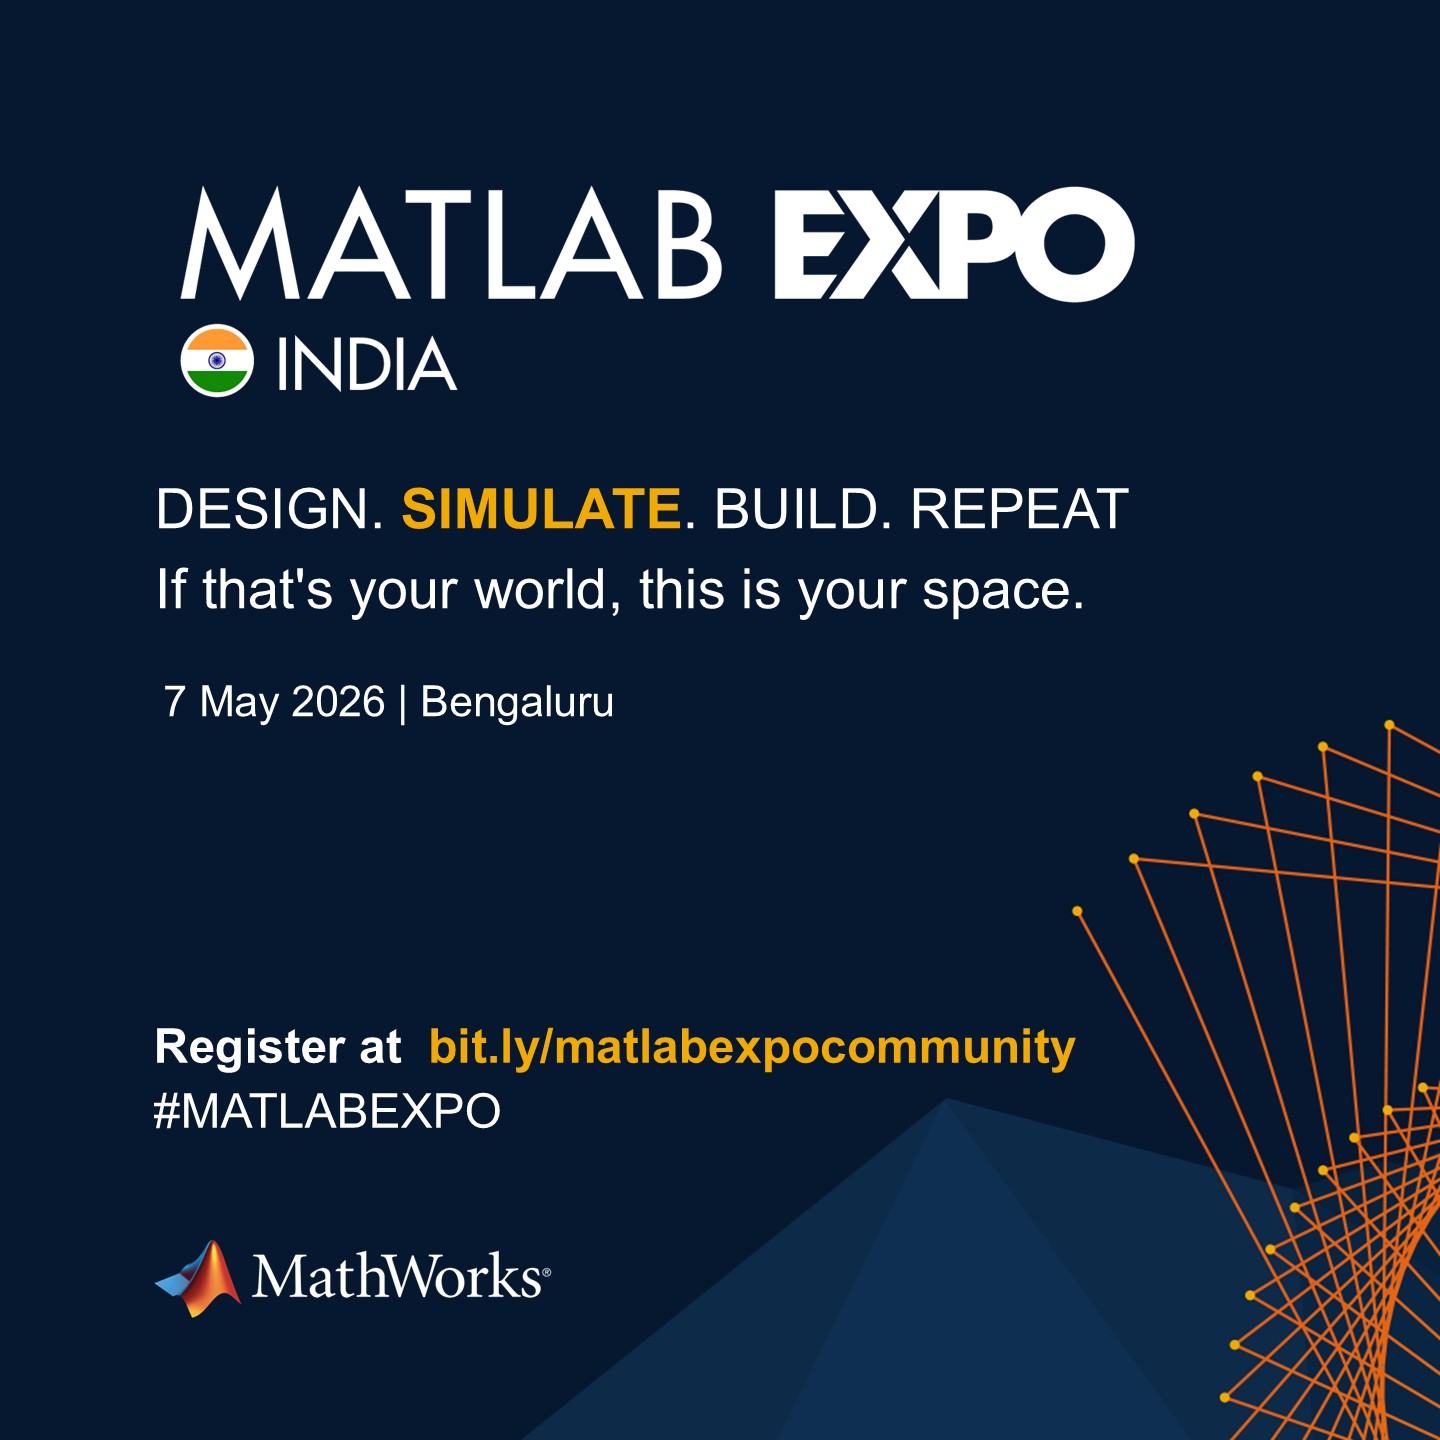
MATLAB EXPO India | 7 May | Bengaluru
Get inspired by the latest trends and real-world customer success stories transforming industries. Learn from trusted experts across 4 tracks.
- AI & Autonomous Systems
- Electrification
- Systems & Software Engineering
- Radar, Wireless & HDL
Register at bit.ly/matlabexpocommunity

Do we know if MATLAB is being used on the Artemis II (moon mission) spacecraft itself? Like is the crew running MATLAB programs? I imagine it was probably at least used in development of some of the components of the spacecraft, rockets, or launch building. Or is it used for any of the image analysis of the images collected by the spacecraft?
Hi all,
I'm a UX researcher here at MathWorks working on the MathWorks Central Community. We're testing a new feature to make it easier to ask a question, and we'd love to hear from community members like you.
Sessions will be next week. They are remote, up to 2 hours (often shorter), and participants receive a $100 stipend. If you're interested, you can click here to schedule.
Thanks in advance! Your feedback directly shapes what gets built.
--David, MathWorks UX Research
MATLAB interprets the first block of uninterupted comments in a function file as documentation. Consider a simple example.
% myfunc This is my function
%
% See also sin
function z = myfunc(x, y)
z = x + y;
end
Those comments are printed in the command window with "help myfunc" and displayed in a separate window with "doc myfunc". A lot of useful things happen behind the scenes as well.
- Hyperlinks are automatically added for valid file names after "See also".
- When dealing with classes, the doc command automatically appends the comment block with a lists of properties and methods.
All this is very handy and as been around for quite some time. However, the doc browser isn't great (forward/back feature was removed several versons ago), the text formatting isn't great, and there is no way to display math.
Although pretty text/math can be displayed in a live document, the traditional *.mlx file format does not always play nice with Git and I have avoided them. However, live documents can now (since 2025a?) be saved in a pure text format, so I began to wonder if all functions should be written in this style. Turns out that all you have to do is append these lines:
%[appendix]{"version":"1.0"}
%---
to the end of any function file to make it a live function. Doing so changes how MATLAB manages that first comment block. The help command seems to be unaffacted, although [text] may appear at the start of each comment line (depending on if the file was create as a live function or subsequently converted). The doc command behaves very different: instead of bringing up the traditional window for custom documentation, the comment block looks like it gets published to HTML and looks more similar to standard MATLAB help. This is a win in some ways, but the "See also" capabilitity is lost.
Curiously, the same text can be appended to the end of a class definition file with some affect. It does not change how the file shows up in the editor, but as in live functions, comments are published when using the doc command. So we are partway to something like a "live class", but not quite.
Should one stick with traditional *.m files or make everything live? Neither does a great job for functions/classes in a namespace--references must explicitly know absolute location in traditional functions, and there is no "See also" concept in a live function. Do we need a command, like cdoc (custom documentation), that pulls out the comment block, publishing formatted text to HTML while simultaneously resolving "See also" references as hyperlinks? If so, it would be great if there were other special commands like "See examples" that would automatically copy and then open an example script for the end user.
I've been trying this problem a lot of time and i don't understand why my solution doesnt't work.
In 4 tests i get the error Assertion failed but when i run the code myself i get the diag and antidiag correctly.
function [diag_elements, antidg_elements] = your_fcn_name(x)
[m, n] = size(x);
% Inicializar los vectores de la diagonal y la anti-diagonal
diag_elements = zeros(1, min(m, n));
antidg_elements = zeros(1, min(m, n));
% Extraer los elementos de la diagonal
for i = 1:min(m, n)
diag_elements(i) = x(i, i);
end
% Extraer los elementos de la anti-diagonal
for i = 1:min(m, n)
antidg_elements(i) = x(m-i+1, i);
end
end
Digital Twin Development of PEARL Autonomous Surface System Thermal Management
The top session of the countdown showcases how the PEARL engineering team used a digital twin to solve real‑world thermal challenges in a solar‑powered autonomous marine platform operating in extreme environments. After thermal shutdown events in the field, the team built a model that predicts temperatures at multiple locations with ~1% accuracy, while balancing accuracy with model complexity.
Beyond the technology, this keynote delivers practical lessons for predictive modeling and digital twins that apply well beyond marine systems.
We hope you’ve enjoyed the Top 10 countdown series—and a big thank‑you to Olivier de Weck at Massachusetts Institute of Technology, for delivering such a compelling and insightful keynote.
🎥 If you missed it live, be sure to watch the recording to see why it earned the #1 spot at MATLAB EXPO 2026.

MATLAB EXPO India is Back!
This in-person events brings together engineers, scientists, and researchers to explore the latest trends in engineering and science, and discover new MATLAB and Simulink capabilities to apply to your work.
May 7, 2026 l Bengaluru
Register at bit.ly/matlabexpocommunity
Dear all,
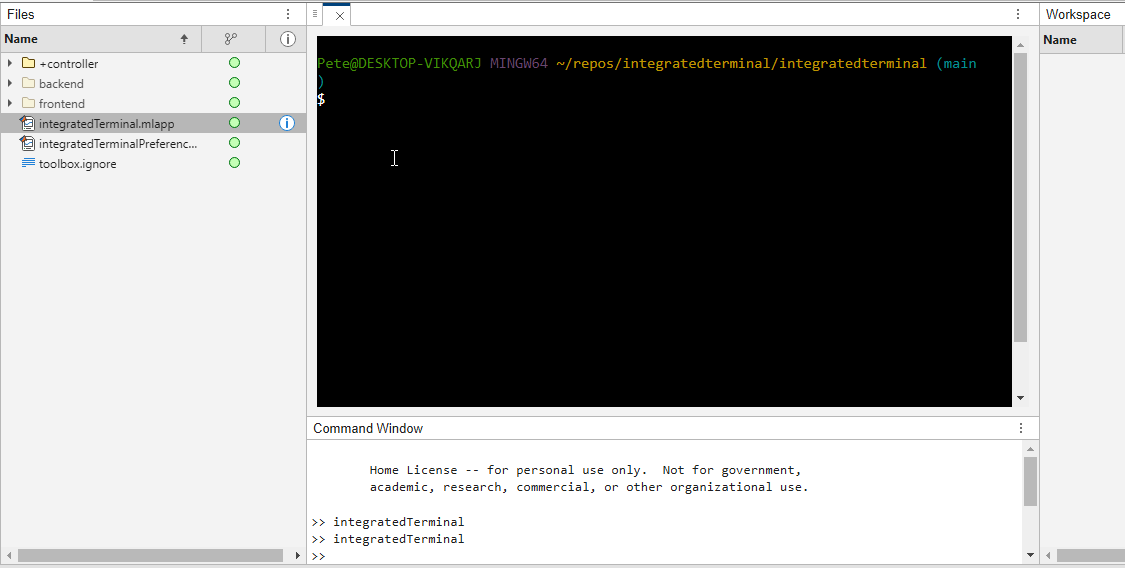
Recently I started working on a VS Code-style integrated terminal for the MATLAB IDE.
The terminal is installed as an app and runs inside a docked figure. You can launch the terminal by clicking on the app icon, running the command integratedTerminal or via keyboard shortcut.
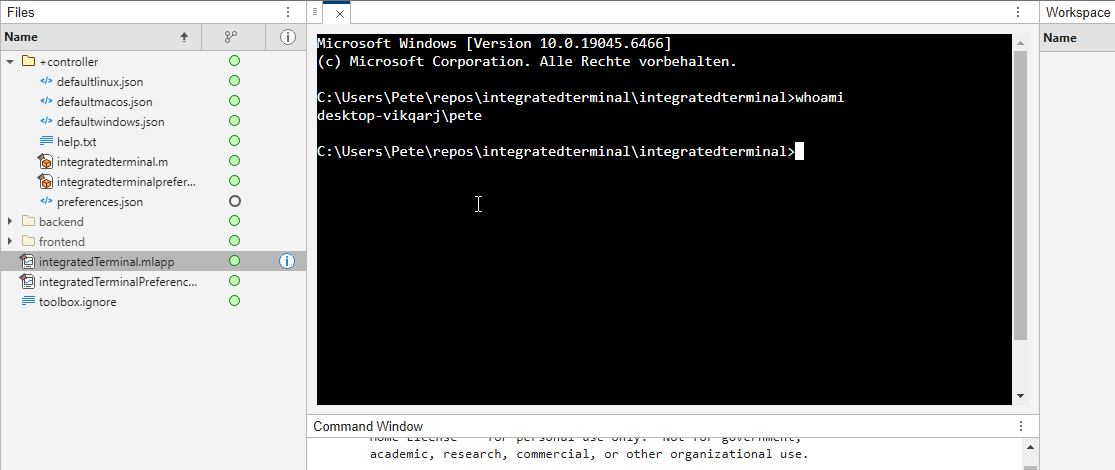
It's possible to change the shell which is used. For example, I can set the shell path to C://Git//bin//bash.exe and use Git Bash on Windows. You can also change the theme. You can run multiple terminals.
I hope you like it and any feedback will be much appreciated. As soon as it's stable enough I can release it as a toolbox.
Matlab seems to follow a rule that iterative reduction operators give appropriate non-empty values to empty inputs. Examples include,
sum([])
prod([])
all([])
any([])
Is it an oversight not to do something similar for min and max?
max([])
For non-empty A and B,
max([A,B])= max(max(A), max(B))
The extension to B=[] should therefore satisfy,
max(A)=max(max(A),max([]))
for any A, which will only be true if we define max([])=-inf.
About Discussions
Discussions is a user-focused forum for the conversations that happen outside of any particular product or project.
Get to know your peers while sharing all the tricks you've learned, ideas you've had, or even your latest vacation photos. Discussions is where MATLAB users connect!
Get to know your peers while sharing all the tricks you've learned, ideas you've had, or even your latest vacation photos. Discussions is where MATLAB users connect!
More Community Areas

MATLAB Answers
Ask & Answer questions about MATLAB & Simulink!

File Exchange
Download or contribute user-submitted code!

Cody
Solve problem groups, learn MATLAB & earn badges!

Blogs
Get the inside view on MATLAB and Simulink!
AI Chat Playground
Use AI to generate initial draft MATLAB code, and answer questions!