pcshowpair
Visualize difference between two point clouds
Description
pcshowpair(
specifies options using one or more name-value arguments in addition to any
combination of arguments from previous syntaxes. For example,
ptCloudA,ptCloudB,Name=Value)pchowpair(ptCloudA,ptCloudB,BackgroundColor="yellow"),
sets the figure background color to yellow.
ax = pcshowpair(___)
Examples
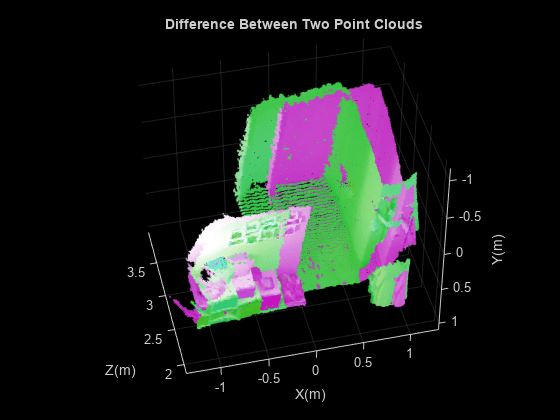
Load two point clouds that were captured using a Kinect device in a home setting.
load("livingRoom");

pc1 = livingRoomData{1};
pc2 = livingRoomData{2};
Plot and set the viewpoint of point clouds.
figure
pcshowpair(pc1,pc2,VerticalAxis="Y",VerticalAxisDir="Down")
title("Difference Between Two Point Clouds")
xlabel("X(m)")
ylabel("Y(m)")
zlabel("Z(m)")
Input Arguments
Name-Value Arguments
Output Arguments
More About
Keyboard shortcuts are enabled only for the rotate (default) mode. To view the axes toolbar operations, point to the figure and select one of these options. Click the Restore View icon to reset the display.
![]()
| Feature | Description | ||||||
|---|---|---|---|---|---|---|---|
| Vertical Axis | Select an X-, Y-, or Z-direction to set the direction of that axis of the point cloud as the positive vertical direction. Use the keyboard arrow keys to move the point cloud with respect to the direction selected. | ||||||
| View Plane | Select the viewing angle of the point cloud figure as the XY, YX, XZ, ZX, YZ, or ZY plane. | ||||||
| Background Color | Display a color chart from which you can select a background color. | ||||||
| Axes On/Off | Turn the display axes on or off. | ||||||
| Projection | Select perspective or orthogonal view. | ||||||
| Export |
| ||||||
| Brush | Enable data brushing mode. | ||||||
| Data Tips | View the point data values of a point by selecting it in the point cloud figure. The Data Tips display shows the x, y, and z values of the points. Point clouds for depth images and lidar contain these additional data properties:
| ||||||
| Rotate 3D | Drag to rotate the point cloud figure. You can also right-click any point on the point cloud figure and select Rotate Around a Point to specify that point as the center of rotation for the figure. To return to axes rotation, right-click again and select Rotate Around Axes Center. While in Rotate 3D mode, you can also select the color source for the point cloud by right-clicking anywhere in the point cloud figure and selecting Color Source, and then selecting an option from the list. The figure applies the active colormap to the point cloud based on the values in the selected source. For a point cloud of only position data, the Color Source options are X, Y, Z, and User Specified. Point clouds for depth image and lidar data include these additional color source options:
| ||||||
| Pan, Zoom in, and Zoom out | Maneuver the point cloud in the figure, or zoom the point cloud figure in or out. | ||||||
| Restore View | Restore the original view of the axes. |
To navigate into a point cloud and observe the scene, use these keyboard shortcuts:
| Action | Keyboard Shortcut | Example |
|---|---|---|
| Move forward or backward through the scene. The camera and the target can move. | w — Forward s — Backward |
|
| Move left or right through the scene. The camera and the target can move. | a — Left d — Right | |
| Look around the scene (pitch/yaw rotation of the camera). Camera position is fixed, target moves. | Up arrow — Camera pitches up Down arrow — Camera pitches down Left arrow — Camera turns left in yaw Right arrow — Camera turns right in yaw |
|
| Roll the scene (roll rotation of the camera). | q — Camera moves clockwise. (Scene appears to move counterclockwise.) e — Camera moves counterclockwise. (Scene appears to move clockwise.) |
|
| Rotate the scene (rotate the camera around the point cloud). Camera position changes, target is fixed. | Shift + Left or Right — Camera orbits horizontally around the point cloud. (Scene appears to stand still as camera moves externally around it horizontally.) Shift + Up or Down — Camera orbits vertically around the point cloud. (Scene appears to stand still as camera moves externally around it vertically.) |
|
| Zoom in or out. | z — Zoom in x — Zoom out |
|
| Look at a view plane. | 1 — XY 2 — YX 3 — XZ 4 — ZX 5 — YZ 6 — ZY Camera positioned in the selected plane with a line of sight to the center of the plot. |
|
| Switch between rotate and pan. | Space bar — Press and hold the space bar to switch the interaction to pan. Release the space bar to switch back to rotate. |
|
| Rotate in X-, Y-, and Z- dimensions. | T — Adds rotate interaction in the third dimension. |
|
| Color Name | Short Name | RGB Triplet | Appearance |
|---|---|---|---|
"red" | "r" | [1 0 0] |
|
"green" | "g" | [0 1 0] |
|
"blue" | "b" | [0 0 1] |
|
"cyan"
| "c" | [0 1 1] |
|
"magenta" | "m" | [1 0 1] |
|
"yellow" | "y" | [1 1 0] |
|
"black" | "k" | [0 0 0] |
|
"white" | "w" | [1 1 1] |
|
Version History
Introduced in R2015bSee Also
Objects
pcviewer|pointCloud|pcplayer|planeModel
Functions
showShape|pcshow|plot3|pcwrite|pcread|pcmerge|scatter3|reconstructScene|triangulate|pcdownsample|pcfitplane|pcdenoise|pcregistericp