PiecewiseLinearDistribution
Piecewise linear probability distribution object
Description
A PiecewiseLinearDistribution object consists of a model
description for a piecewise linear probability distribution.
The piecewise linear distribution is a nonparametric probability distribution created using a piecewise linear representation of the cumulative distribution function (cdf). The options specified for the piecewise linear distribution specify the form of the cdf. The probability density function (pdf) is a step function.
The piecewise linear distribution uses the following parameters.
| Parameter | Description |
|---|---|
x | Vector of x values at which the cdf changes slope |
Fx | Vector of cdf values that correspond to each value in
x |
Creation
Create a PiecewiseLinearDistribution probability distribution with
specified parameter values object using makedist.
Properties
Object Functions
cdf | Cumulative distribution function |
icdf | Inverse cumulative distribution function |
iqr | Interquartile range of probability distribution |
mean | Mean of probability distribution |
median | Median of probability distribution |
pdf | Probability density function |
plot | Plot probability distribution object |
random | Random numbers |
std | Standard deviation of probability distribution |
truncate | Truncate probability distribution object |
var | Variance of probability distribution |
Examples
Create a piecewise linear distribution object using the default parameter values.
pd = makedist('PiecewiseLinear')pd = PiecewiseLinearDistribution F(0) = 0 F(1) = 1
Compute the empirical cumulative distribution function (cdf) for data, and create a piecewise linear distribution object using an approximation to the empirical cdf.
Load the sample data. Visualize the patient weight data using a histogram.
load patients
histogram(Weight(strcmp(Gender,'Female')))
hold on
histogram(Weight(strcmp(Gender,'Male')))
legend('Female','Male')

The histogram shows that the data has two modes, one for female patients and one for male patients.
Compute the empirical cdf for the data.
[f,x] = ecdf(Weight);
Construct a piecewise linear approximation to the empirical cdf by taking a value every five points.
f = f(1:5:end);
x = x(1:5:end);
Plot the empirical cdf and the approximation.
figure
ecdf(Weight)
hold on
plot(x,f,'ko-','MarkerFace','r')
legend('Empirical cdf','Piecewise linear approximation', ...
    'Location','best')
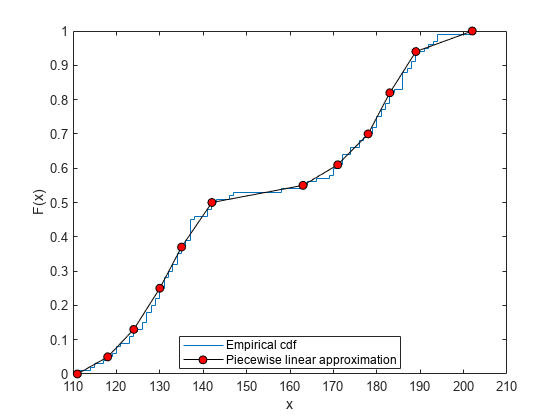
Create a piecewise linear probability distribution object using the piecewise approximation of the empirical cdf.
pd = makedist('PiecewiseLinear','x',x,'Fx',f)
pd =
  PiecewiseLinearDistribution

F(111) = 0
F(118) = 0.05
F(124) = 0.13
F(130) = 0.25
F(135) = 0.37
F(142) = 0.5
F(163) = 0.55
F(171) = 0.61
F(178) = 0.7
F(183) = 0.82
F(189) = 0.94
F(202) = 1
Generate 100 random numbers from the distribution.
rng('default') % For reproducibility
rw = random(pd,[100,1]);
Plot the random numbers to visually compare their distribution to the original data.
figure
histogram(Weight)
hold on
histogram(rw)
legend('Original data','Generated data')

The random numbers generated from the piecewise linear distribution have the same bimodal distribution as the original data.
Version History
Introduced in R2013a