Hyperparameter Optimization in Regression Learner App
After you choose a particular type of model to train, for example a decision tree or a support vector machine (SVM), you can tune your model by selecting different advanced options. For example, you can change the minimum leaf size of a decision tree or the box constraint of an SVM. Some of these options are internal parameters of the model, or hyperparameters, that can strongly affect its performance. Instead of manually selecting these options, you can use hyperparameter optimization within the Regression Learner app to automate the selection of hyperparameter values. For a given model type, the app tries different combinations of hyperparameter values by using an optimization scheme that seeks to minimize the model mean squared error (MSE), and returns a model with the optimized hyperparameters. You can use the resulting model as you would any other trained model.
Note
Because hyperparameter optimization can lead to an overfitted model, the recommended approach is to create a separate test set before importing your data into the Regression Learner app. After you train your optimizable model, you can see how it performs on your test set. For an example, see Train Regression Model Using Hyperparameter Optimization in Regression Learner App.
To perform hyperparameter optimization in Regression Learner, follow these steps:
Choose a model type and decide which hyperparameters to optimize. See Select Hyperparameters to Optimize.
Note
Hyperparameter optimization is not supported for the models in Linear Regression Models.
(Optional) Specify how the optimization is performed. For more information, see Optimization Options.
Train your model. Use the Minimum MSE Plot to track the optimization results.
Inspect your trained model. See Optimization Results.
Select Hyperparameters to Optimize
In the Regression Learner app, in the Models section of the Learn tab, click the arrow to open the gallery. The gallery includes optimizable models that you can train using hyperparameter optimization.
After you select an optimizable model, you can choose which of its hyperparameters you want to optimize. In the model Summary tab, in the Model Hyperparameters section, select Optimize check boxes for the hyperparameters that you want to optimize. Under Values, specify the fixed values for the hyperparameters that you do not want to optimize or that are not optimizable.
This table describes the hyperparameters that you can optimize for each type of model and the search range of each hyperparameter. It also includes the additional hyperparameters for which you can specify fixed values.
| Model | Optimizable Hyperparameters | Additional Hyperparameters | Notes |
|---|---|---|---|
| Optimizable Tree |
|
| For more information, see Regression Tree Model Hyperparameter Options. |
| Optimizable SVM |
|
For more information, see SVM Model Hyperparameter Options. | |
| Optimizable Efficient Linear |
|
| For more information, see Efficiently Trained Linear Model Hyperparameter Options. |
| Optimizable GPR |
|
|
For more information, see Gaussian Process Regression Model Hyperparameter Options. |
| Optimizable Kernel |
|
| For more information, see Kernel Model Hyperparameter Options. |
| Optimizable Ensemble |
|
For more information, see Ensemble Model Hyperparameter Options. | |
| Optimizable Neural Network |
|
| For more information, see Neural Network Model Hyperparameter Options. |
Optimization Options
By default, the Regression Learner app performs hyperparameter tuning by using Bayesian optimization. The goal of Bayesian optimization, and optimization in general, is to find a point that minimizes an objective function. In the context of hyperparameter tuning in the app, a point is a set of hyperparameter values, and the objective function is the loss function, or the mean squared error (MSE). For more information on the basics of Bayesian optimization, see Bayesian Optimization Workflow.
You can specify how the hyperparameter tuning is performed. For example, you can change the optimization method to grid search or limit the training time. On the Learn tab, in the Options section, click Optimizer. The app opens a dialog box in which you can select optimization options.
After making your selections, click Save and Apply. Your selections affect all draft optimizable models in the Models pane and will be applied to new optimizable models that you create using the gallery in the Models section of the Learn tab.
To specify optimization options for a single optimizable model, open and edit the model summary before training the model. Click the model in the Models pane. The model Summary tab includes an editable Optimizer section.
This table describes the available optimization options and their default values.
| Option | Description |
|---|---|
| Optimizer | The optimizer values are:
|
| Acquisition function | When the app performs Bayesian optimization for hyperparameter tuning, it uses the acquisition function to determine the next set of hyperparameter values to try. The acquisition function values are:
For details on how these acquisition functions work in the context of Bayesian optimization, see Acquisition Function Types. |
| Iterations | Each iteration corresponds to a combination of
hyperparameter values that the app tries. When you use
Bayesian optimization or random search, specify a positive
integer that sets the number of iterations. The default
value is When you use grid search, the app ignores the Iterations value and evaluates the loss at every point in the entire grid. You can set a training time limit to stop the optimization process prematurely. |
| Training time limit | To set a training time limit, select this option and set the Maximum training time in seconds option. By default, the app does not have a training time limit. |
| Maximum training time in seconds | Set the training time limit in seconds as a positive real
number. The default value is 300. The run
time can exceed the training time limit because this limit does
not interrupt an iteration evaluation. |
| Number of grid divisions | When you use grid search, set a positive integer as the
number of values the app tries for each numeric hyperparameter.
The app ignores this value for categorical hyperparameters. The
default value is 10. |
Minimum MSE Plot
After specifying which model hyperparameters to optimize and setting any additional optimization options (optional), train your optimizable model. On the Learn tab, in the Train section, click Train All and select Train Selected. The app creates a Minimum MSE Plot that it updates as the optimization runs.
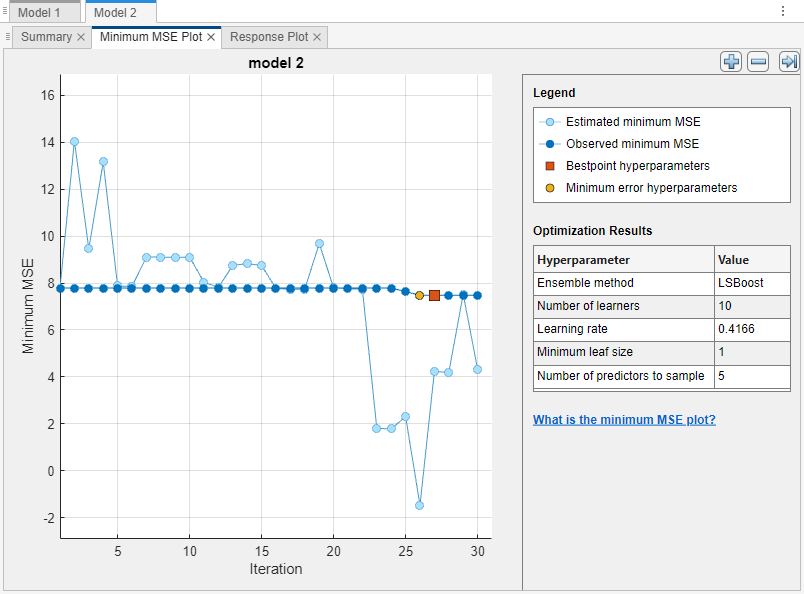
The minimum mean squared error (MSE) plot displays the following information:
Estimated minimum MSE – Each light blue point corresponds to an estimate of the minimum MSE computed by the optimization process when considering all the sets of hyperparameter values tried so far, including the current iteration.
The estimate is based on an upper confidence interval of the current MSE objective model, as mentioned in the Bestpoint hyperparameters description.
If you use grid search or random search to perform hyperparameter optimization, the app does not display these light blue points.
Observed minimum MSE – Each dark blue point corresponds to the observed minimum MSE computed so far by the optimization process. For example, at the third iteration, the blue point corresponds to the minimum of the MSE observed in the first, second, and third iterations.
Bestpoint hyperparameters – The red square indicates the iteration that corresponds to the optimized hyperparameters. You can find the values of the optimized hyperparameters listed in the upper right of the plot under Optimization Results.
The optimized hyperparameters do not always provide the observed minimum MSE. When the app performs hyperparameter tuning by using Bayesian optimization (see Optimization Options for a brief introduction), it chooses the set of hyperparameter values that minimizes an upper confidence interval of the MSE objective model, rather than the set that minimizes the MSE. For more information, see the
"Criterion","min-visited-upper-confidence-interval"name-value argument ofbestPoint.Minimum error hyperparameters – The yellow point indicates the iteration that corresponds to the hyperparameters that yield the observed minimum MSE.
For more information, see the
"Criterion","min-observed"name-value argument ofbestPoint.
Missing points in the plot correspond to NaN minimum MSE
values.
Optimization Results
When the app finishes tuning model hyperparameters, it returns a model trained with the optimized hyperparameter values (Bestpoint hyperparameters). The model metrics, displayed plots, and exported model correspond to this trained model with fixed hyperparameter values.
When you perform hyperparameter tuning using Bayesian optimization and you export
a trained optimizable model to the workspace as a structure, the structure includes
a BayesianOptimization object in the
HyperParameterOptimizationResult field. The object contains
the results at each optimization iteration, and the final best results of the
optimization performed in the app.
To inspect the optimization results of a trained optimizable model, select the model in the Models pane and look at the model Summary tab.
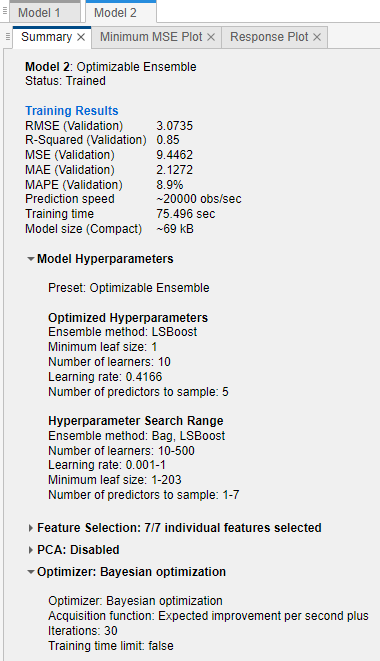
The Summary tab includes these sections:
Training Results – Shows the performance of the optimizable model. See View Model Metrics in Summary Tab and Models Pane.
Model Hyperparameters – Displays the type of optimizable model and lists any fixed hyperparameter values
Optimized Hyperparameters – Lists the values of the optimized hyperparameters
Hyperparameter Search Range – Displays the search ranges for the optimized hyperparameters
Optimizer – Shows the selected optimizer options
When you generate MATLAB® code from a trained optimizable model, the generated code uses the fixed and optimized hyperparameter values of the model to train on new data. The generated code does not include the optimization process. For information on how to perform Bayesian optimization when you use a fit function, see Bayesian Optimization Using a Fit Function.
See Also
Topics
- Train Regression Model Using Hyperparameter Optimization in Regression Learner App
- Bayesian Optimization Workflow
- Train Regression Models in Regression Learner App
- Choose Model Options In Regression Learner
- Visualize and Assess Model Performance in Regression Learner
- Export Regression Model to Predict New Data