loss
Classification loss for classification tree model
Syntax
Description
L = loss(tree,Tbl,ResponseVarName)L for the trained classification tree model
tree using the predictor data in table
Tbl and the true class labels in
Tbl.ResponseVarName. The interpretation of
L depends on the loss function
(LossFun) and weighting scheme
(Weights). In general, better classifiers yield smaller
classification loss values.
L = loss(___,Name=Value)
Examples
Compute the resubstituted classification error for the ionosphere data set.
load ionosphere
tree = fitctree(X,Y);
L = loss(tree,X,Y)
L = 0.0114
Unpruned decision trees tend to overfit. One way to balance model complexity and out-of-sample performance is to prune a tree (or restrict its growth) so that in-sample and out-of-sample performance are satisfactory.
Load Fisher's iris data set. Partition the data into training (50%) and validation (50%) sets.
load fisheriris
n = size(meas,1);
rng(1) % For reproducibility
idxTrn = false(n,1);
idxTrn(randsample(n,round(0.5*n))) = true; % Training set logical indices
idxVal = idxTrn == false;                  % Validation set logical indices
Grow a classification tree using the training set.
Mdl = fitctree(meas(idxTrn,:),species(idxTrn));
View the classification tree.
view(Mdl,'Mode','graph');
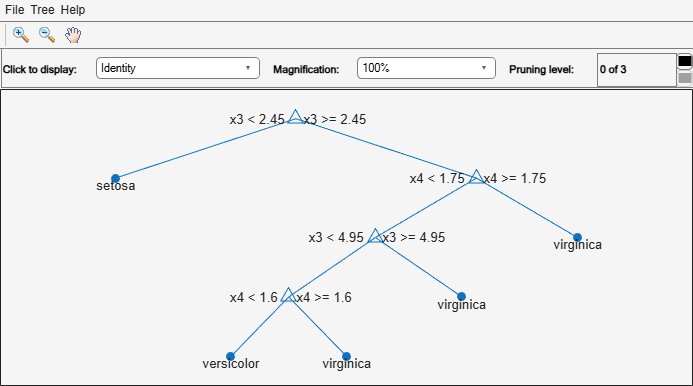
The classification tree has four pruning levels. Level 0 is the full, unpruned tree (as displayed). Level 3 is just the root node (i.e., no splits).
Examine the training sample classification error for each subtree (or pruning level) excluding the highest level.
m = max(Mdl.PruneList) - 1;
trnLoss = resubLoss(Mdl,'Subtrees',0:m)
trnLoss = 3×1
0.0267
0.0533
0.3067
The full, unpruned tree misclassifies about 2.7% of the training observations.
The tree pruned to level 1 misclassifies about 5.3% of the training observations.
The tree pruned to level 2 (i.e., a stump) misclassifies about 30.6% of the training observations.
Examine the validation sample classification error at each level excluding the highest level.
valLoss = loss(Mdl,meas(idxVal,:),species(idxVal),'Subtrees',0:m)valLoss = 3×1
0.0369
0.0237
0.3067
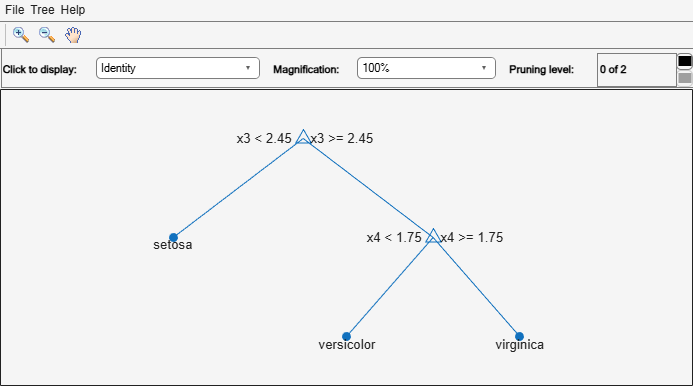
The full, unpruned tree misclassifies about 3.7% of the validation observations.
The tree pruned to level 1 misclassifies about 2.4% of the validation observations.
The tree pruned to level 2 (i.e., a stump) misclassifies about 30.7% of the validation observations.
To balance model complexity and out-of-sample performance, consider pruning Mdl to level 1.
pruneMdl = prune(Mdl,'Level',1);
view(pruneMdl,'Mode','graph')
Input Arguments
Name-Value Arguments
Output Arguments
More About
Classification loss functions measure the predictive inaccuracy of classification models. When you compare the same type of loss among many models, a lower loss indicates a better predictive model.
Consider the following scenario.
L is the weighted average classification loss.
n is the sample size.
For binary classification:
yj is the observed class label. The software codes it as –1 or 1, indicating the negative or positive class (or the first or second class in the
ClassNamesproperty), respectively.f(Xj) is the positive-class classification score for observation (row) j of the predictor data X.
mj = yjf(Xj) is the classification score for classifying observation j into the class corresponding to yj. Positive values of mj indicate correct classification and do not contribute much to the average loss. Negative values of mj indicate incorrect classification and contribute significantly to the average loss.
For algorithms that support multiclass classification (that is, K ≥ 3):
yj* is a vector of K – 1 zeros, with 1 in the position corresponding to the true, observed class yj. For example, if the true class of the second observation is the third class and K = 4, then y2* = [
0 0 1 0]′. The order of the classes corresponds to the order in theClassNamesproperty of the input model.f(Xj) is the length K vector of class scores for observation j of the predictor data X. The order of the scores corresponds to the order of the classes in the
ClassNamesproperty of the input model.mj = yj*′f(Xj). Therefore, mj is the scalar classification score that the model predicts for the true, observed class.
The weight for observation j is wj. The software normalizes the observation weights so that they sum to the corresponding prior class probability stored in the
Priorproperty. Therefore,
Given this scenario, the following table describes the supported loss functions that you can specify by using the LossFun name-value argument.
| Loss Function | Value of LossFun | Equation |
|---|---|---|
| Binomial deviance | "binodeviance" | |
| Observed misclassification cost | "classifcost" | where is the class label corresponding to the class with the maximal score, and is the user-specified cost of classifying an observation into class when its true class is yj. |
| Misclassified rate in decimal | "classiferror" | where I{·} is the indicator function. |
| Cross-entropy loss | "crossentropy" |
The weighted cross-entropy loss is where the weights are normalized to sum to n instead of 1. |
| Exponential loss | "exponential" | |
| Hinge loss | "hinge" | |
| Logistic loss | "logit" | |
| Minimal expected misclassification cost | "mincost" |
The software computes the weighted minimal expected classification cost using this procedure for observations j = 1,...,n.
The weighted average of the minimal expected misclassification cost loss is |
| Quadratic loss | "quadratic" |
If you use the default cost matrix (whose element value is 0 for correct classification
and 1 for incorrect classification), then the loss values for
"classifcost", "classiferror", and
"mincost" are identical. For a model with a nondefault cost matrix,
the "classifcost" loss is equivalent to the "mincost"
loss most of the time. These losses can be different if prediction into the class with
maximal posterior probability is different from prediction into the class with minimal
expected cost. Note that "mincost" is appropriate only if classification
scores are posterior probabilities.
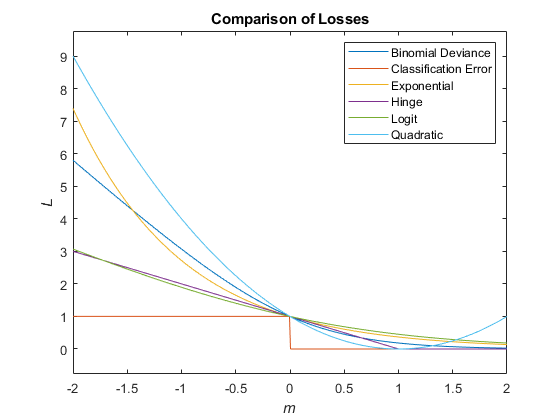
This figure compares the loss functions (except "classifcost",
"crossentropy", and "mincost") over the score
m for one observation. Some functions are normalized to pass through
the point (0,1).
Extended Capabilities
Version History
Introduced in R2011a
See Also
margin | edge | predict | fitctree | ClassificationTree | CompactClassificationTree