plot
Description
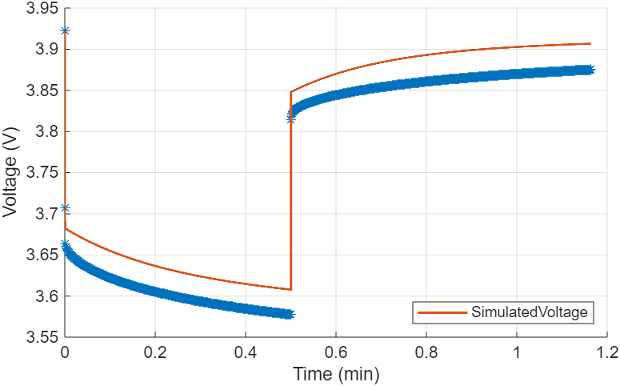
plot( plots the measured and
simulated voltage for all pulses inside the circuitModel)ECM object,
cicuitModel. The ECM object retains or saves a copy
of the pulse data which you can then use for comparison purposes. The function obtains the
simulated voltage by running a MATLAB®-based battery equivalent circuit model (ECM). This model is stored in the
simulateCurrentPulse function of the ECM object.
plot(
plots the measured and simulated voltage for the pulses inside the circuitModel,pulseIds)ECM
object, cicuitModel, at the indices specified by
pulseIds.
plot(___, also
specifies options using one or more name-value arguments.Name=Value)
chart = plot(___)VoltageVerificationChart object.
Examples
This example shows how to plot the measured and simulated voltage of
a specific pulse inside an ECM object.
Open the DownloadBatteryData example and load the required HPPC
data obtained for a BAK 2.9 Ah battery cell at 25 °C. This data consists of a table with
three columns. The columns of the table refer to time, voltage, and current values,
respectively.
openExample("simscapebattery/DownloadBatteryDataExample")
load("testDataBAKcells/hppcDataBAKcell25degC.mat")
Store the HPPC data inside an HPPCTest object by using the hppcTest function. The HPPC data is a table,
so you must also specify each column name by using the TimeVariable,
VoltageVariable, and CurrentVariable arguments.
These names must match the names of the columns in the hppcData
table.
hppcExp = hppcTest(hppcData,...
    TimeVariable="time (s)",...
    VoltageVariable="voltage (V)",...
    CurrentVariable="current (A)");
Fit the HPPC data in the hppcExp object to a battery equivalent
circuit model (ECM). To fit the data and create an ECM object, use the
fitECM
function.
batteryEcm = fitECM(hppcExp);
Analyze how the function performed the fit on the ECM for the fourth pulse in the
HPPC data by using the plot function.
plot(batteryEcm,4)
Input Arguments
Name-Value Arguments
Output Arguments
Version History
Introduced in R2025a