show
Description
Add-On Required: This feature requires the Robotics System Toolbox Offroad Autonomy Library add-on.
show( displays the
traversability grid map map)map in the current axes.
himage = show(___)show.
show(___,
specifies additional options specified by one or more name-value
arguments.Name=Value)
Examples
Create a sample digital elevation model and define the resolution of the map. The resolution determines the grid cell size in meters, balancing detail, and computation cost.
load("pitMineDEM.mat", "elevationModel", "resolution")
Create the traversability map object for terrain navigability analysis and visualization.
map = traversabilityMap(elevationModel, resolution);
Define thresholds for terrain properties such as slope, step height, and roughness.
In this case, areas with slope less than or equal to 10° are considered safe whereas areas with slope greater than 15° are non-traversable.
map.SlopeThreshold = [10, 15] * pi / 180; % in radiansAreas with a step height below 1 m are considered safe, while those above 2 m are considered critical, within a window size of 6 m. Assume this window size for step height computation to be equal to the length of the vehicle.
map.StepHeightThreshold = [1, 2]; % in metres
map.StepHeightWindowSize = 6; % in metres
Areas with roughness below 0.1 are considered safe and that above 0.3 are considered critical.
map.RoughnessThreshold = [0.1, 0.3]; % in metresAssign custom cost weights to these terrain properties. The cost weights assign a relative importance to each property in computing the overall traversability cost of terrain. The object normalizes these weights, meaning their sum ideally equals 1 for intuitive scaling.
For an offroad vehicle, set the cost weight of slope to 0.7 to prioritize avoiding steep slopes, step height to 0.2 assuming that the vehicle can handle moderate steps but should still avoid large ones, and roughness to 0.1 as an uneven terrain such as gravel, is less critical to the vehicle's ability to move.
map.CostWeight = [0.7, 0.2, 0.1];
Display the map with a colorbar to visualize the cost distribution.
figure;
ax = show(map, "grid");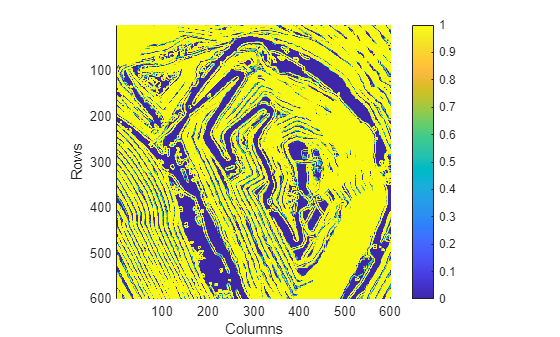
Input Arguments
Name-Value Arguments
Extended Capabilities
Version History
Introduced in R2025a