cost
Syntax
Description
Add-On Required: This feature requires the Robotics System Toolbox Offroad Autonomy Library add-on.
mapData = cost(map,bottomLeft,mapSize)map. The
subregion starts in the bottom-left xy-position
bottomLeft in world coordinates with a given map size
mapSize specified as [width height] in
meters.
mapData = cost(map,bottomLeft,mapSize,"local")
Examples
Create traversability map with a sample digital elevation model (DEM) and set the map resolution.
The resolution sets the size of each grid cell in meters. A smaller value of resolution gives finer details.
resolution = 1.25; % cells per meter
[xdata, ydata] = meshgrid(0:resolution:100, flip(0:resolution:100)); % x and y axes data of the terrain
elevationModel = peaks(size(xdata,1)); % Terrain elevation in meters
elevationModel(elevationModel<0) = 0; % Discard valleys
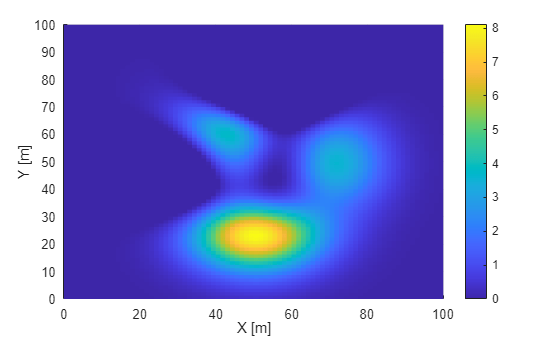
Visualize digital elevation model (DEM) of the terrain.
figure;
surf(xdata, ydata, elevationModel, EdgeColor="none");
xlabel('X [m]')
ylabel('Y [m]')
zlabel('Elevation [m]')
view(2)
colorbar
Create traversability map from the digital elevation model (DEM).
map = traversabilityMap(elevationModel, resolution)
map =
  traversabilityMap with properties:

          SlopeThreshold: [0.2000 0.3000]
      RoughnessThreshold: [0.1000 0.2000]
     StepHeightThreshold: [1.1352 1.7323]
    StepHeightWindowSize: 5.6000
              CostWeight: [1 1 1]
       GridOriginInLocal: [0 0]
              Resolution: 1.2500
            XLocalLimits: [0 64.8000]
            YLocalLimits: [0 64.8000]
Display the traversability map.
show(map, "local")
Enable SlopeThreshold and set the safe and critical values.
Flexible threshold values allow intermediate terrains with moderate slopes (for example, between 10° and 15°) to have a cost but remain traversable. In this case, areas with slope ≤ 10° are considered safe whereas areas with slope > 15° are non-traversable. Areas between the safe and critical thresholds are assigned intermediate cost values.
safeSlope = 10 * pi / 180;
criticalSlope = 15 * pi / 180;
map.SlopeThreshold = [safeSlope, criticalSlope];
Set the StepHeightThreshold and RoughnessThreshold to infinity to disable their influence.
map.StepHeightThreshold = inf; % No limit on step height
map.RoughnessThreshold = inf; % No limit on roughness
Display the updated traversability map in the local coordinate frame.
show(map, "local")
Define a window using the x- and y-axis coordinates, its bottom-left corner and its width and height. Extract the data for that window.
mapData = getMapData(map, [20,30], [5,7]);
disp("Traversability Map Data:");
Traversability Map Data:
disp(mapData);
    0.8802    1.0000    1.0000    1.0000    1.0000    1.0000    1.0000
         0    1.0000    1.0000    1.0000    1.0000    1.0000    1.0000
         0         0    1.0000    1.0000    1.0000    1.0000    1.0000
         0         0         0    1.0000    1.0000    1.0000    1.0000
         0         0         0    0.7495    1.0000    1.0000    1.0000
         0         0         0         0    1.0000    1.0000    1.0000
         0         0         0         0         0    1.0000    1.0000
         0         0         0         0         0    0.8712    1.0000
         0         0         0         0         0         0    1.0000
To configure strict slope threshold, set identical values for safe and critical threshold limits. This use case is applicable for offroad vehicles designed for flat terrains or with low tolerance for inclines.
strictSlope = 10 * pi / 180;
map.SlopeThreshold = [strictSlope, strictSlope];
Visualize the updated traversability map. You can access the traversability data by using getMapData.
show(map, "local")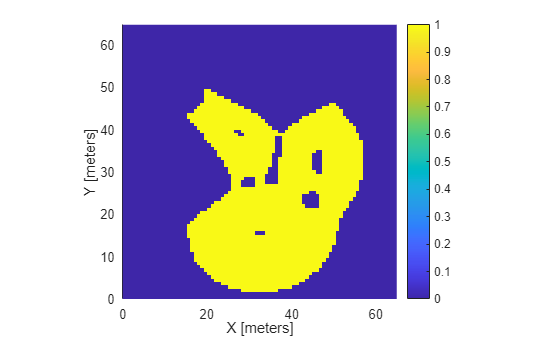
Input Arguments
Output Arguments
Extended Capabilities
Version History
Introduced in R2025a