spline
Cubic spline data interpolation
Description
Examples
Use spline to interpolate a sine curve over unevenly-spaced sample points.
x = [0 1 2.5 3.6 5 7 8.1 10];
y = sin(x);
xx = 0:.25:10;
yy = spline(x,y,xx);
plot(x,y,'o',xx,yy)
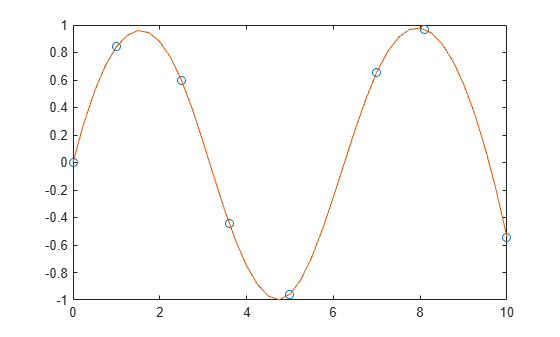
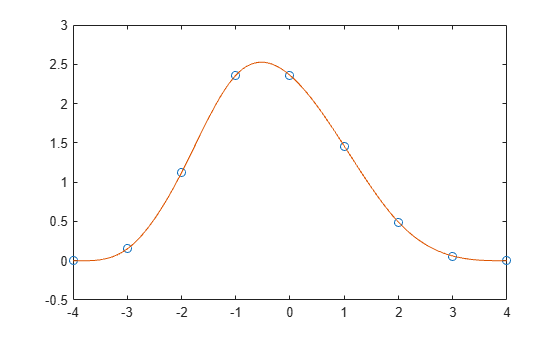
Use clamped or complete spline interpolation when endpoint slopes are known. To do this, you can specify the values vector with two extra elements, one at the beginning and one at the end, to define the endpoint slopes.
Create a vector of data and another vector with the -coordinates of the data.
x = -4:4; y = [0 .15 1.12 2.36 2.36 1.46 .49 .06 0];
Interpolate the data using spline and plot the results. Specify the second input with two extra values [0 y 0] to signify that the endpoint slopes are both zero. Use ppval to evaluate the spline fit over 101 points in the interpolation interval.
cs = spline(x,[0 y 0]); xx = linspace(-4,4,101); plot(x,y,'o',xx,ppval(cs,xx),'-');

Extrapolate a data set to predict population growth.
Create two vectors to represent the census years from 1900 to 1990 (t) and the corresponding United States population in millions of people (p).
t = 1900:10:1990;
p = [ 75.995 91.972 105.711 123.203 131.669 ...
150.697 179.323 203.212 226.505 249.633 ];Extrapolate and predict the population in the year 2000 using a cubic spline.
spline(t,p,2000)
ans = 270.6060
Generate the plot of a circle, with the five data points y(:,2),...,y(:,6) marked with o's. The matrix y contains two more columns than does x. Therefore, spline uses y(:,1) and y(:,end) as the endslopes. The circle starts and ends at the point (1,0), so that point is plotted twice.
x = pi*[0:.5:2];
y = [0 1 0 -1 0 1 0;
1 0 1 0 -1 0 1];
pp = spline(x,y);
yy = ppval(pp, linspace(0,2*pi,101));
plot(yy(1,:),yy(2,:),'-b',y(1,2:5),y(2,2:5),'or')
axis equal
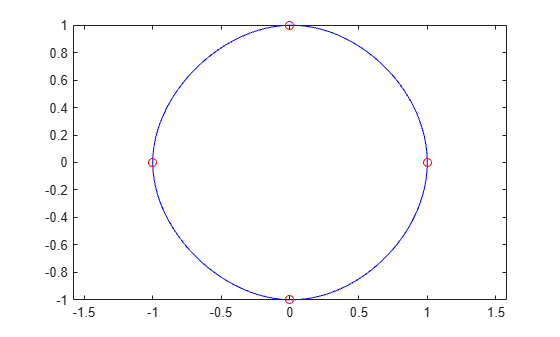
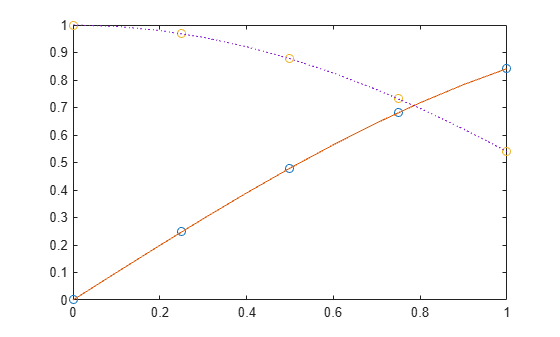
Use spline to sample a function over a finer mesh.
Generate sine and cosine curves for a few values between 0 and 1. Use spline interpolation to sample the functions over a finer mesh.
x = 0:.25:1; Y = [sin(x); cos(x)]; xx = 0:.1:1; YY = spline(x,Y,xx); plot(x,Y(1,:),'o',xx,YY(1,:),'-') hold on plot(x,Y(2,:),'o',xx,YY(2,:),':') hold off

Compare the interpolation results produced by spline, pchip, and makima for two different data sets. These functions all perform different forms of piecewise cubic Hermite interpolation. Each function differs in how it computes the slopes of the interpolant, leading to different behaviors when the underlying data has flat areas or undulations.
Compare the interpolation results on sample data that connects flat regions. Create vectors of x values, function values at those points y, and query points xq. Compute interpolations at the query points using spline, pchip, and makima. Plot the interpolated function values at the query points for comparison.
x = -3:3; y = [-1 -1 -1 0 1 1 1]; xq1 = -3:.01:3; p = pchip(x,y,xq1); s = spline(x,y,xq1); m = makima(x,y,xq1); plot(x,y,'o',xq1,p,'-',xq1,s,'-.',xq1,m,'--') legend('Sample Points','pchip','spline','makima','Location','SouthEast')

In this case, pchip and makima have similar behavior in that they avoid overshoots and can accurately connect the flat regions.
Perform a second comparison using an oscillatory sample function.
x = 0:15; y = besselj(1,x); xq2 = 0:0.01:15; p = pchip(x,y,xq2); s = spline(x,y,xq2); m = makima(x,y,xq2); plot(x,y,'o',xq2,p,'-',xq2,s,'-.',xq2,m,'--') legend('Sample Points','pchip','spline','makima')

When the underlying function is oscillatory, spline and makima capture the movement between points better than pchip, which is aggressively flattened near local extrema.
Input Arguments
x-coordinates, specified as a vector. The
vector x specifies the points at which the data y is
given. The elements of x must be unique.
Cubic spline interpolation requires at least 4 points, falling back to linear or quadratic interpolation if 2 or 3 points are supplied, respectively.
Data Types: single | double
Function values at x-coordinates, specified as a numeric vector, matrix, or
array. x and y typically have the same
length, but y also can have exactly two more elements
than x to specify endslopes.
If y is a matrix or array, then the values in the last dimension,
y(:,...,:,j), are taken as the values to match with
x. In that case, the last dimension of
y must be the same length as x or
have exactly two more elements.
The endslopes of the cubic spline follow these rules:
If
xandyare vectors of the same size, then the not-a-knot end conditions are used.If
xoryis a scalar, then it is expanded to have the same length as the other and the not-a-knot end conditions are used.If
yis a vector that contains two more values thanxhas entries, thensplineuses the first and last values inyas the endslopes for the cubic spline. For example, ifyis a vector, then:y(2:end-1)gives the function values at each point inxy(1)gives the slope at the beginning of the interval located atmin(x)y(end)gives the slope at the end of the interval located atmax(x)
Similarly, if
yis a matrix or anN-dimensional array withsize(y,N)equal tolength(x)+2, then:y(:,...,:,j+1)gives the function values at each point inxforj = 1:length(x)y(:,:,...:,1)gives the slopes at the beginning of the intervals located atmin(x)y(:,:,...:,end)gives the slopes at the end of the intervals located atmax(x)
Data Types: single | double
Query points, specified as a scalar, vector, matrix, or array. The points
specified in xq are the x-coordinates
for the interpolated function values yq computed by
spline.
Data Types: single | double
Output Arguments
Interpolated values at query points, returned as a scalar, vector, matrix, or array.
The size of s is related to the sizes of y and
xq:
If
yis a vector, thenshas the same size asxq.If
yis an array of sizeNy = size(y), then these conditions apply:If
xqis a scalar or vector, thensize(s)returns[Ny(1:end-1) length(xq)].If
xqis an array, thensize(s)returns[Ny(1:end-1) size(xq)].
Piecewise polynomial, returned as a structure. Use this structure
with the ppval function to
evaluate the piecewise polynomial at one or more query points. The
structure has these fields.
| Field | Description |
|---|---|
form |
|
breaks | Vector of length |
coefs |
|
pieces | Number of pieces, |
order | Order of the polynomials |
dim | Dimensionality of target |
Since the polynomial coefficients in coefs are
local coefficients for each interval, you must subtract the lower
endpoint of the corresponding knot interval to use the coefficients
in a conventional polynomial equation. In other words, for the coefficients [a,b,c,d] on
the interval [x1,x2], the corresponding polynomial
is
Tips
You also can perform spline interpolation using the
interp1function with the commandinterp1(x,y,xq,'spline'). Whilesplineperforms interpolation on rows of an input matrix,interp1performs interpolation on columns of an input matrix.
Algorithms
A tridiagonal linear system (possibly with several right-hand
sides) is solved for the information needed to describe the coefficients
of the various cubic polynomials that make up the interpolating spline. spline uses
the functions ppval, mkpp,
and unmkpp. These routines form a small suite
of functions for working with piecewise polynomials. For access to
more advanced features, see interp1 or
the Curve Fitting Toolbox™ spline functions.
References
[1] de Boor, Carl. A Practical Guide to Splines. Springer-Verlag, New York: 1978.
Extended Capabilities
Usage notes and limitations:
Input
xmust be strictly increasing.Code generation does not remove
yentries withNaNvalues.Code generation does not report an error for infinite endslopes in
y.If you generate code for the
pp = spline(x,y)syntax, then you cannot inputppto theppvalfunction in MATLAB®. To create a MATLABppstructure from appstructure created by the code generator:In code generation, use
unmkppto return the piecewise polynomial details to MATLAB.In MATLAB, use
mkppto create theppstructure.
If you supply
xq, and ifyhas a variable-size and is not a variable-length vector, then the orientation of vector outputs in the generated code might not match the orientation in MATLAB.
This function fully supports thread-based environments. For more information, see Run MATLAB Functions in Thread-Based Environment.
The spline function
supports GPU array input with these usage notes and limitations:
The input argument
ymust be non-sparse.
For more information, see Run MATLAB Functions on a GPU (Parallel Computing Toolbox).
Version History
Introduced before R2006a
MATLAB Command
You clicked a link that corresponds to this MATLAB command:
Run the command by entering it in the MATLAB Command Window. Web browsers do not support MATLAB commands.
Select a Web Site
Choose a web site to get translated content where available and see local events and offers. Based on your location, we recommend that you select: .
You can also select a web site from the following list
How to Get Best Site Performance
Select the China site (in Chinese or English) for best site performance. Other MathWorks country sites are not optimized for visits from your location.
Americas
- América Latina (Español)
- Canada (English)
- United States (English)
Europe
- Belgium (English)
- Denmark (English)
- Deutschland (Deutsch)
- España (Español)
- Finland (English)
- France (Français)
- Ireland (English)
- Italia (Italiano)
- Luxembourg (English)
- Netherlands (English)
- Norway (English)
- Österreich (Deutsch)
- Portugal (English)
- Sweden (English)
- Switzerland
- United Kingdom (English)