allcycles
Find all cycles in graph
Description
[
also returns the edges in each cycle. The output cycles,edgecycles] = allcycles(G)edgecycles is a cell
array where edgecycles{k} gives the edges in the corresponding cycle,
cycles{k}.
[___] = allcycles(
specifies additional options using one or more name-value arguments. You can use any of the
output argument combinations in previous syntaxes. For example, you can specify
G,Name,Value)MaxNumCycles and a scalar to limit the number of cycles
returned.
Examples
Create a directed graph with nine nodes. Plot the graph.
s = [1 2 3 6 5 5 4 6 9 8 8 7];
t = [2 3 6 5 2 4 1 9 8 5 7 4];
G = digraph(s,t);
plot(G)
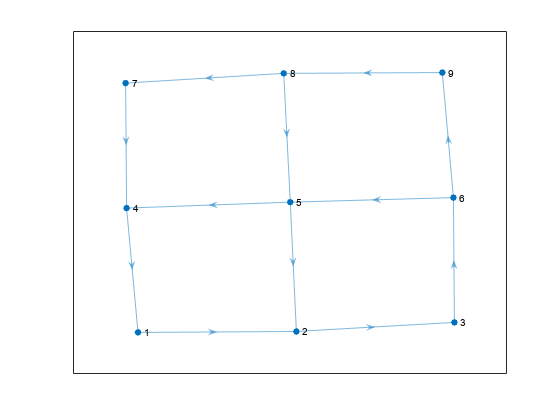
Calculate all cycles in the graph.
cycles = allcycles(G)
cycles=5×1 cell array
    {[    1 2 3 6 5 4]}
    {[1 2 3 6 9 8 5 4]}
    {[1 2 3 6 9 8 7 4]}
    {[        2 3 6 5]}
    {[    2 3 6 9 8 5]}
The second output argument of allcycles returns the edges that are contained in each cycle. This is particularly useful for multigraphs, where the edge index is required to uniquely identify the edges in each cycle.
Create a directed multigraph with eight nodes and 18 edges. Specify names for the nodes. Plot the graph with labeled nodes and edges.
s = [1 1 2 2 3 3 2 2 4 6 8 6 6 7 3 3 5 3];
t = [2 3 1 3 2 1 4 4 6 2 6 7 8 8 5 5 7 7];
names = {'A','B','C','D','E','F','G','H'};
G = digraph(s,t,[],names);
p = plot(G,'EdgeLabel',1:numedges(G));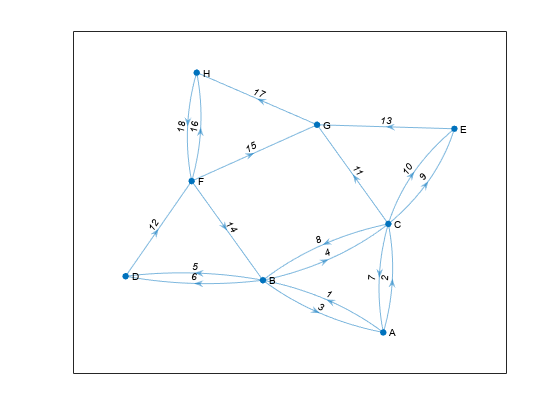
Calculate all cycles in the graph. Specify two output arguments to also return the edge indices for edges in each cycle.
[cycles,edgecycles] = allcycles(G);
View the nodes and edges in the fifth cycle.
cycles{5}ans = 1×7 cell
{'A'} {'C'} {'E'} {'G'} {'H'} {'F'} {'B'}
edgecycles{5}ans = 1×7
2 9 13 17 18 14 3
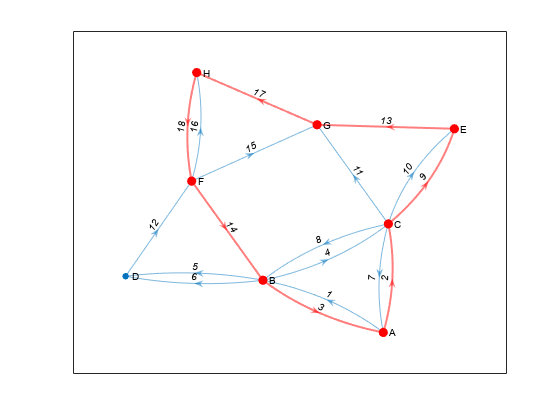
Highlight the nodes and edges in the fifth cycle.
highlight(p,'Edges',edgecycles{5},'EdgeColor','r','LineWidth',1.5,'NodeColor','r','MarkerSize',6)
Use the 'MaxNumCycles', 'MaxCycleLength', and 'MinCycleLength' options to limit the number of cycles returned by allcycles.
Create an adjacency matrix for a complete graph with 20 nodes. Create an undirected graph from the adjacency matrix, omitting self-loops.
A = ones(20);
G = graph(A,'omitselfloops');
Since all of the nodes in the graph are connected to all other nodes, there are a large number of cycles in the graph (more than 1.7e17). Therefore, it is not feasible to calculate all of the cycles since the results will not fit in memory. Instead, calculate the first 10 cycles.
cycles1 = allcycles(G,'MaxNumCycles',10)cycles1=10×1 cell array
{[ 1 2 3]}
{[ 1 2 3 4]}
{[ 1 2 3 4 5]}
{[ 1 2 3 4 5 6]}
{[ 1 2 3 4 5 6 7]}
{[ 1 2 3 4 5 6 7 8]}
{[ 1 2 3 4 5 6 7 8 9]}
{[ 1 2 3 4 5 6 7 8 9 10]}
{[ 1 2 3 4 5 6 7 8 9 10 11]}
{[1 2 3 4 5 6 7 8 9 10 11 12]}
Now calculate the first 10 cycles that have a cycle length less than or equal to 3.
cycles2 = allcycles(G,'MaxNumCycles',10,'MaxCycleLength',3)
cycles2=10×1 cell array
    {[ 1 2 3]}
    {[ 1 2 4]}
    {[ 1 2 5]}
    {[ 1 2 6]}
    {[ 1 2 7]}
    {[ 1 2 8]}
    {[ 1 2 9]}
    {[1 2 10]}
    {[1 2 11]}
    {[1 2 12]}
Finally, calculate the first 10 cycles that have a cycle length greater than or equal to 4.
cycles3 = allcycles(G,'MaxNumCycles',10,'MinCycleLength',4)
cycles3=10×1 cell array
    {[                      1 2 3 4]}
    {[                    1 2 3 4 5]}
    {[                  1 2 3 4 5 6]}
    {[                1 2 3 4 5 6 7]}
    {[              1 2 3 4 5 6 7 8]}
    {[            1 2 3 4 5 6 7 8 9]}
    {[         1 2 3 4 5 6 7 8 9 10]}
    {[      1 2 3 4 5 6 7 8 9 10 11]}
    {[   1 2 3 4 5 6 7 8 9 10 11 12]}
    {[1 2 3 4 5 6 7 8 9 10 11 12 13]}
Examine how the outputs of the cyclebasis and allcycles functions scale with the number of edges in a graph.
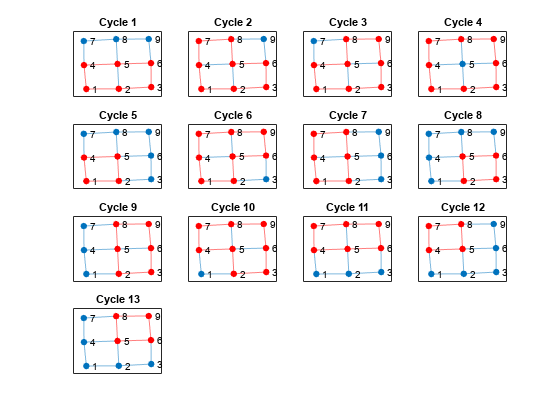
Create and plot a square grid graph with three nodes on each side of the square.
n = 5;
A = delsq(numgrid('S',n));
G = graph(A,'omitselfloops');
plot(G)
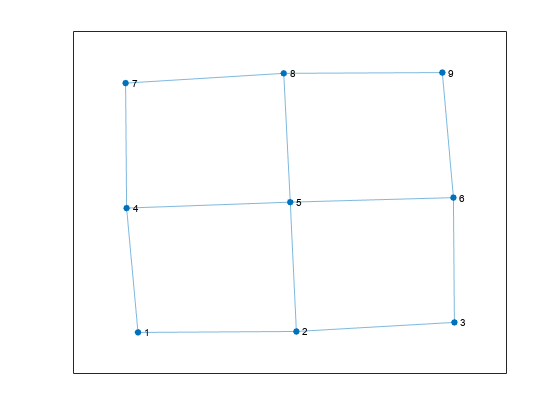
Compute all cycles in the graph using allcycles. Use the tiledlayout function to construct an array of subplots and highlight each cycle in a subplot. The results indicate there are a total of 13 cycles in the graph.
[cycles,edgecycles] = allcycles(G);
tiledlayout flow
for k = 1:length(cycles)
    nexttile
    highlight(plot(G),cycles{k},'Edges',edgecycles{k},'EdgeColor','r','NodeColor','r')
    title("Cycle " + k)
end
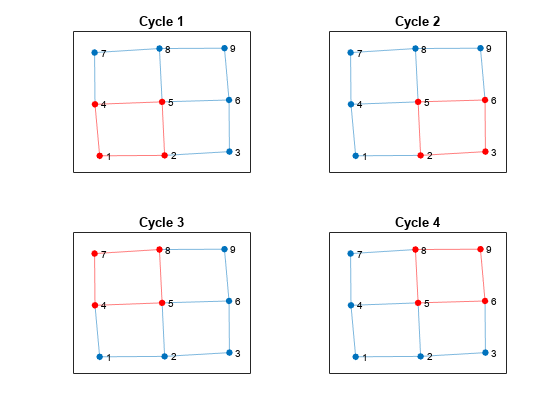
Some of these cycles can be seen as combinations of smaller cycles. The cyclebasis function returns a subset of the cycles that form a basis for all other cycles in the graph. Use cyclebasis to compute the fundamental cycle basis and highlight each fundamental cycle in a subplot. Even though there are 13 cycles in the graph, there are only four fundamental cycles.
[cycles,edgecycles] = cyclebasis(G);
tiledlayout flow
for k = 1:length(cycles)
    nexttile
    highlight(plot(G),cycles{k},'Edges',edgecycles{k},'EdgeColor','r','NodeColor','r')
    title("Cycle " + k)
end
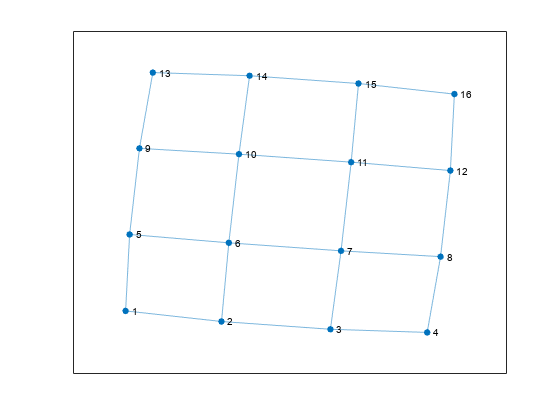
Now, increase the number of nodes on each side of the square graph from three to four. This represents a small increase in the size of the graph.
n = 6;
A = delsq(numgrid('S',n));
G = graph(A,'omitselfloops');
figure
plot(G)
Use allcycles to compute all of the cycles in the new graph. For this graph there are over 200 cycles, which is too many to plot.
allcycles(G)
ans=213×1 cell array
    {[                       1 2 3 4 8 7 6 5]}
    {[                  1 2 3 4 8 7 6 10 9 5]}
    {[1 2 3 4 8 7 6 10 11 12 16 15 14 13 9 5]}
    {[      1 2 3 4 8 7 6 10 11 15 14 13 9 5]}
    {[            1 2 3 4 8 7 6 10 14 13 9 5]}
    {[                 1 2 3 4 8 7 11 10 6 5]}
    {[                 1 2 3 4 8 7 11 10 9 5]}
    {[           1 2 3 4 8 7 11 10 14 13 9 5]}
    {[     1 2 3 4 8 7 11 12 16 15 14 10 6 5]}
    {[     1 2 3 4 8 7 11 12 16 15 14 10 9 5]}
    {[     1 2 3 4 8 7 11 12 16 15 14 13 9 5]}
    {[1 2 3 4 8 7 11 12 16 15 14 13 9 10 6 5]}
    {[           1 2 3 4 8 7 11 15 14 10 6 5]}
    {[           1 2 3 4 8 7 11 15 14 10 9 5]}
    {[           1 2 3 4 8 7 11 15 14 13 9 5]}
    {[      1 2 3 4 8 7 11 15 14 13 9 10 6 5]}
      ⋮
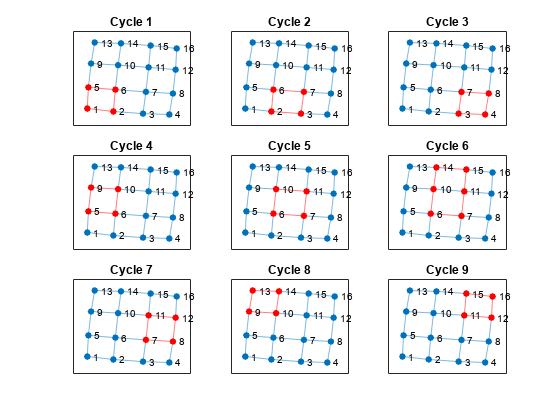
Despite the large number of cycles in the graph, cyclebasis still returns a small number of fundamental cycles. Each of the cycles in the graph can be constructed using only nine fundamental cycles.
[cycles,edgecycles] = cyclebasis(G);
figure
tiledlayout flow
for k = 1:length(cycles)
    nexttile
    highlight(plot(G),cycles{k},'Edges',edgecycles{k},'EdgeColor','r','NodeColor','r')
    title("Cycle " + k)
end
The large increase in the number of cycles with only a small change in the size of the graph is typical for some graph structures. The number of cycles returned by allcycles can grow exponentially with the number of edges in the graph. However, the number of cycles returned by cyclebasis can, at most, grow linearly with the number of edges in the graph.
Input Arguments
Name-Value Arguments
Output Arguments
More About
Tips
The number of cycles in a graph depends heavily on the structure of the graph. For some graph structures, the number of cycles can grow exponentially with the number of nodes. For example, a complete graph with 12 nodes given by
G =
            graph(ones(12))
contains nearly 60 million cycles. Use theMaxNumCycles,MaxCycleLength, andMinCycleLengthoptions to control the output ofallcyclesin these cases.
Version History
Introduced in R2021a