Visualize UAV Flight Path on 2-D and 3-D Maps
This example visualizes a simulated unmanned aerial vehicle (UAV) flight from the Mauna Loa Baseline Observatory to the top of the Mauna Loa Volcano in Hawaii. First, display the track on geographic axes and a geographic globe. Then, synchronize the view and visualize the flight path by using camera navigation functions. Finally, view the top of the Mauna Loa volcano as a panorama.
Visualize Area of Interest in 2-D
The use of UAVs to track characteristics of changing topology, gasses, and ash clouds around volcanoes is becoming an important area of research for scientists [1]. A UAV can travel in areas of interest (AOIs) that are hazardous for a volcanologist. Simulating the flight path of the UAV prior to sending it out on a mission can assist with understanding the topology and terrain. To gain an overview and 2-D perspective of the AOI, view the locations of the Mauna Loa Baseline Observatory and the Mauna Loa Volcano in a geographic axes.
Get Coordinates of Mauna Loa Baseline Observatory
Specify the coordinates of the Mauna Loa Baseline Observatory [2]. The height of the observatory is in meters above mean sea level (MSL).
obslat = 19.5362;
obslon = -155.5763;
obsH = 3397.00;
Get Coordinates of Mauna Loa Volcano
Specify the coordinates of the top of Mauna Loa [3]. The height of the volcano is orthometric and is in meters.
mllat = 19.475;
mllon = -155.608;
mlH = 4169;
View Mauna Loa Baseline Observatory and Mauna Loa Volcano in 2-D
For a 2-D perspective of the AOI, use geoaxes and geoplot to plot the location of the observatory and the top of the volcano.
figure
geoaxes(Basemap="satellite",ZoomLevel=12)
hold on
geoplot(obslat,obslon,"ow",MarkerSize=10,MarkerFaceColor="magenta",DisplayName="Mauna Loa Observatory")
geoplot(mllat,mllon,"ow",MarkerSize=10,MarkerFaceColor="blue",DisplayName="Mauna Loa Volcano")
legend

Synchronize View of Mauna Loa Baseline Observatory in 2-D and 3-D
Use the geographic axes to view the observatory in 2-D and the geographic globe to view the observatory in 3-D.
Create Geographic Axes and Geographic Globe in Same Figure
Set up a 2-D and 3-D map display by creating geographic axes and a geographic globe in the same UI figure. To view more of the 2-D map, set the InnerPosition of the geographic axes to its OuterPosition. To view both map displays with the same basemap, set the basemap of the geographic axes to "satellite".
figpos = [1000 500 800 400];
uif = uifigure(Position=figpos);
ug = uigridlayout(uif,[1,2]);
p1 = uipanel(ug);
p2 = uipanel(ug);
gx = geoaxes(p1,Basemap="satellite");
gg = geoglobe(p2);
gx.InnerPosition = gx.OuterPosition;
gg.Position = [0 0 1 1];
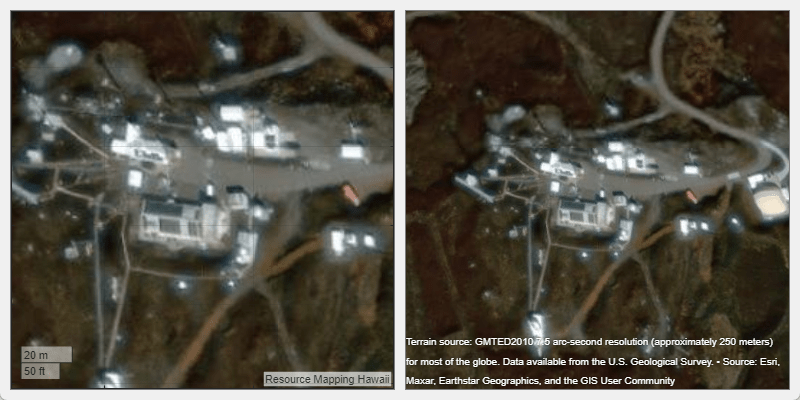
View Observatory in 2-D
View the observatory from 200 meters above the terrain. Control the view of the geographic axes by changing its map center and zoom level. You can synchronize the view of the geographic axes with the view of the geographic globe by converting the camera height of the globe to a zoom level for the axes. Calculate an approximate zoom level from terrain height by using the heightToZoomLevel local function.
heightAboveTerrain = 200;
gx.MapCenter = [obslat obslon];
zoomLevel = heightToZoomLevel(heightAboveTerrain,obslat);
gx.ZoomLevel = zoomLevel;
View Observatory in 3-D
Control the view of the geographic globe by changing the position of the camera. The campos function requires you to specify ellipsoidal height (relative to the WGS84 ellipsoid) instead of orthometric height (relative to mean sea level). Convert the height of the observatory to ellipsoidal height. All heights are in meters.
N = egm96geoid(obslat,obslon);
obsh = obsH + N;
ellipsoidalHeight = obsh + heightAboveTerrain;
campos(gg,obslat,obslon,ellipsoidalHeight)
drawnow
Import Flight Track Data and Calculate Heading and 3-D Distance
Import the simulated flight track from the Mauna Loa Baseline Observatory to the top of the Mauna Loa volcano. The file contains the latitudes, longitudes, and altitudes of the UAV path, referenced to mean sea level.
T = readgeotable("sample_uavtrack.gpx",Layer="track_points");
tlat = T.Shape.Latitude';
tlon = T.Shape.Longitude';
talt = T.Elevation';
Calculate Flight Headings
Calculate the UAV heading at each track point using the azimuth function. The azimuth function calculates values using a clockwise-positive convention.
wgs84 = wgs84Ellipsoid;
theading = azimuth(tlat(1:end-1),tlon(1:end-1),tlat(2:end),tlon(2:end),wgs84);
theading = [theading(1);theading(:)];
Calculate 3-D Distances
Calculate the cumulative distance for the UAV flight track. The distance function does not take into account changes in elevation or altitude. In order to calculate the distance the UAV moves from point to point in 3-D, you need to work in geocentric Cartesian coordinates (X, Y, Z). Compute the point-to-point offset components (in meters) using the ecefOffset function. The altitude data of the UAV flight is referenced to the mean sea level. To use the ecefOffset function, the heights must be referenced to the ellipsoid. Convert the orthometric heights of the flight track to ellipsoidal height (relative to the WGS84 ellipsoid). All heights are in meters.
N = egm96geoid(tlat,tlon);
h = talt + N;
Compute distance offsets.
lat1 = tlat(1:end-1);
lat2 = tlat(2:end);
lon1 = tlon(1:end-1);
lon2 = tlon(2:end);
h1 = h(1:end-1);
h2 = h(2:end);
[dx,dy,dz] = ecefOffset(wgs84,lat1,lon1,h1,lat2,lon2,h2);
Calculate the Euclidean distance between each pair of adjacent points using the hypot function. The distance is in meters.
distanceIncrementIn3D = hypot(hypot(dx, dy), dz);
Compute cumulative distance in 3-D and the total distance in meters.
cumulativeDistanceIn3D = cumsum(distanceIncrementIn3D);
totalDistanceIn3D = sum(distanceIncrementIn3D);
fprintf("Total UAV track distance is %f meters.\n",totalDistanceIn3D)
Total UAV track distance is 8931.072120 meters.
Assign a variable for the cumulative distance to be used for plotting the animation.
tdist = [0 cumulativeDistanceIn3D];
Plot Flight Line from Mauna Loa Baseline Observatory to top of Mauna Loa Volcano
Plot the simulated flight line from the Mauna Loa Baseline Observatory to the top of the Mauna Loa volcano.
Plot the flight line. By default, the geographic globe places the line at the center of the display. The view of the geographic axes will not change because you have previously set the MapCenter and ZoomLevel.
geoplot3(gg,tlat,tlon,talt,"c",LineWidth=2,HeightReference="geoid")
ptrack = geoplot(gx,tlat,tlon,"c",LineWidth=2);
Set the map center and zoom level to be consistent with the 3-D view by converting the camera height for the globe to the zoom level for the axes.
[clat,clon,cheight] = campos(gg);
gx.MapCenter = [clat clon];
gx.ZoomLevel = heightToZoomLevel(cheight,clat);
drawnow
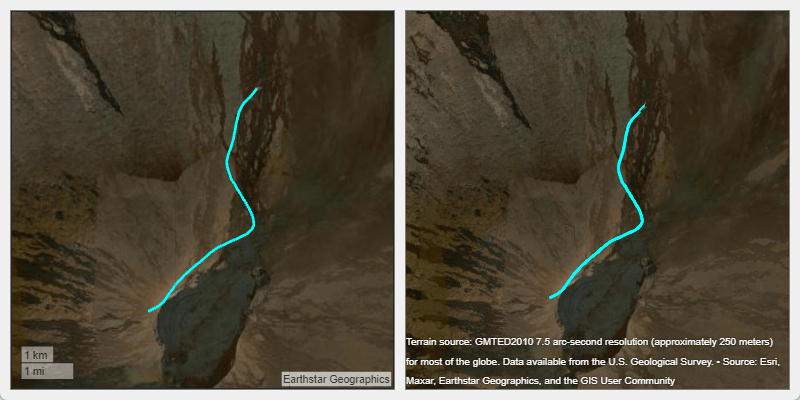
Set Initial View from Mauna Loa Baseline Observatory to Top of Mauna Loa Volcano
View the flight line from the start position by setting the camera position to the first coordinate of the track. For a better perspective, set the camera height to 75 meters about the height of the track. View straight down to the observatory by setting the camera pitch to -90. View the track by setting the heading to the third element of the calculated heading array since the first two points of the track are the same location and the calculated heading for those locations is 0.
campos(gg,tlat(1),tlon(1))
camheight(gg,talt(1) + 75)
campitch(gg,-90)
camheading(gg,theading(3))
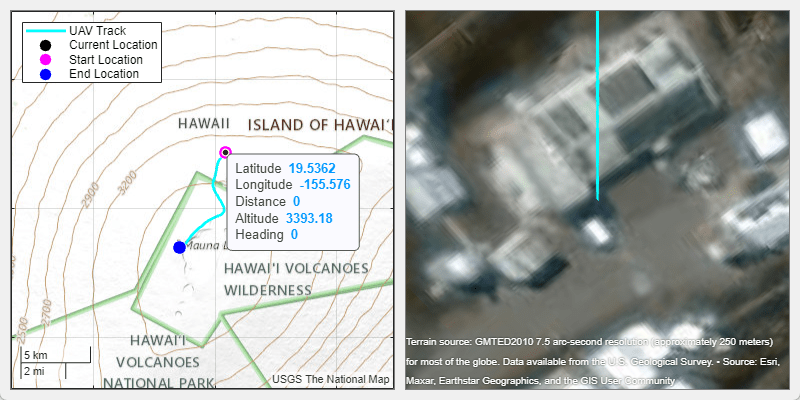
On the 2-D map, show the start and end locations of the flight track using markers, and show the location of the UAV using an icon. Create a legend for the UAV track, the markers, and the icon.
hold(gx,"on")
mstart = geoplot(gx,tlat(1),tlon(1),"ow",MarkerSize=10,MarkerFaceColor="magenta");
mend = geoplot(gx,tlat(end),tlon(end),"ow",MarkerSize=10,MarkerFaceColor="blue");
icon = geoiconchart(gx,tlat(1),tlon(1),"uav.png",SizeData=30);

icon.DisplayName = "Current Location";
mstart.DisplayName = "Start Location";
mend.DisplayName = "End Location";
ptrack.DisplayName = "UAV Track";
legend(gx)
Add the USGS Topographic Map basemap from the USGS National Map. Then, view the topology of the AOI by changing the basemap and zoom level.
url = "https://basemap.nationalmap.gov/ArcGIS/rest/services/USGSTopo/MapServer/tile/${z}/${y}/${x}/png";
addCustomBasemap("usgstopo",url,Attribution="USGS The National Map")

gx.Basemap = "usgstopo";
gx.ZoomLevel = 11;
Create a data tip that corresponds to the current latitude and longitude of the UAV.
dt = datatip(ptrack,DataIndex=1,Location="northwest");Customize the data tip by formatting the latitude and longitude rows, and by adding rows that indicate the altitude of the UAV, the heading of the UAV, and the distance from the observatory.
ptrack.DataTipTemplate.DataTipRows(1).Format = "%.3f";
ptrack.DataTipTemplate.DataTipRows(2).Format = "%.3f";

dtrow = dataTipTextRow("Distance",tdist,"%.2f");
dtrow(end+1) = dataTipTextRow("Altitude",talt,"%.2f");
dtrow(end+1) = dataTipTextRow("Heading",theading,"%.2f");
ptrack.DataTipTemplate.DataTipRows(end+1:end+3) = dtrow;
Fly from Mauna Loa Baseline Observatory to Top of Mauna Loa Volcano
Animate a flight from the Mauna Loa Baseline Observatory to the top of the Mauna Loa volcano.
For a better view of the flight track as the UAV navigates to the top of the volcano, update the camera pitch value.
pitch = -2.7689;
campitch(gg,pitch)
Animate the flight on the 2-D map and 3-D globe.
View the location of the UAV on the 2-D map by updating the latitude, longitude, and rotation angle of the icon. The
IconRotationproperty rotates the angle in a counterclockwise-positive direction, so use the negative of the value returned by theazimuthfunction.View the current location, altitude, and heading of the UAV by updating the data tip to use the current index.
Animate the 3-D flight by setting the camera position.
for k = 2:(length(tlat)-1)
    % update icon on 2-D map
    set(icon,"LatitudeData",tlat(k),"LongitudeData",tlon(k),"IconRotation",-theading(k))

    % update data tip on 2-D map
    dt.DataIndex = k;

    % update camera position for 3-D globe
    campos(gg,tlat(k),tlon(k))
    camheight(gg,talt(k)+100)
    camheading(gg,theading(k))

    drawnow
    pause(.25)
end

campos(gg,tlat(end),tlon(end),talt(end)+100)
dt.DataIndex = length(tlat);

View a 360-Degree Panorama from Top of Mauna Loa Volcano
View a 360-degree panorama from the top of Mauna Loa by rotating the camera heading and the icon 360 degrees. Rotate clockwise with a step size of 5-degrees and start at the next 5 degree step. Update the heading data tip.
initialHeading = camheading(gg);
increment = 5;
initialHeading = initialHeading + (increment - mod(initialHeading,increment));

for degree = initialHeading:increment:initialHeading+360
    heading = mod(degree,360);
    camheading(gg,heading);
    icon.IconRotation = -heading;
    ptrack.DataTipTemplate.DataTipRows(end).Value(dt.DataIndex) = heading;
    drawnow
end

Local Functions
Convert Height (in meters above WGS84 ellipsoid) to Zoom Level
function zoomLevel = heightToZoomLevel(height, lat)
    earthCircumference = 2 * pi * 6378137;
    zoomLevel = log2((earthCircumference *cosd(lat)) / height) + 1;
    zoomLevel = max(0, zoomLevel);
    zoomLevel = min(19, zoomLevel);
end
References
[1] Williams, Sarah C. P. “Studying Volcanic Eruptions with Aerial Drones.” Proceedings of the National Academy of Sciences of the United States of America 110, no. 27 (July 2, 2013): 10881. https://doi.org/10.1073/pnas.1309922110.
[2] NOAA. “Mauna Loa Baseline Observatory.” Global Monitoring Laboratory. Accessed June 16, 2020. https://gml.noaa.gov/obop/mlo/.
[3] USGS. “Mauna Loa.” Hawaiian Volcano Observatory. Accessed June 16, 2020. https://www.usgs.gov/volcanoes/mauna-loa.
See Also
Functions
azimuth|campos|camroll|camheading|campitch|egm96geoid