plotm
Project 2-D lines and points on axesm-based map
Description
plotm(
uses name-value pair arguments to specify any number of Line Properties except for
lat,lon,Name,Value)XData, YData, and
ZData. Name is the property name and
Value is the corresponding value. Name
must appear inside single quotes (' '). You can specify several
name and value pair arguments in any order as
Name1,Value1,...,NameN,ValueN. Property names can be
abbreviated, and case does not matter.
h = plotm(___)
Examples
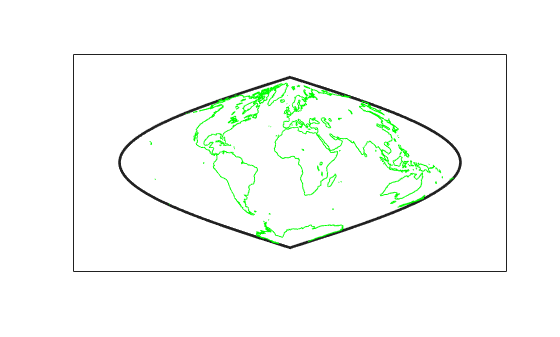
First, load coastline data into the workspace and create a map. Then, plot the data. The plotm function uses the NaN values in coastlat and coastlon to break the data into separate lines.
load coastlines
ax = axesm('sinusoid','Frame','on');
plotm(coastlat,coastlon,'g')
Input Arguments
Latitude or longitude vector, specified as a numeric vector. Specify
values in units that match the AngleUnits property of the
axesm-based map. lat and
lon must be the same size.
Create breaks in lines or polygons using NaN values.
For example, this code plots the first three elements, skips the fourth
element, and draws another line using the last three
elements.
lat = [0 1 2 NaN 4 5 6];
lon = [0 1 2 NaN 3 4 5];
axesm('UTM','Zone','31N','Frame','on')
plotm(lat,lon)
Line style, marker, and color, specified as a string scalar or character vector containing symbols. The symbols can appear in any order. You do not need to specify all three characteristics (line style, marker, and color). For example, if you omit the line style and specify the marker, then the plot shows only the marker and no line.
Example: "--or" is a red dashed line with circle markers.
| Line Style | Description | Resulting Line |
|---|---|---|
"-" | Solid line |
|
"--" | Dashed line |
|
":" | Dotted line |
|
"-." | Dash-dotted line |
|
| Marker | Description | Resulting Marker |
|---|---|---|
"o" | Circle |
|
"+" | Plus sign |
|
"*" | Asterisk |
|
"." | Point |
|
"x" | Cross |
|
"_" | Horizontal line |
|
"|" | Vertical line |
|
"square" | Square |
|
"diamond" | Diamond |
|
"^" | Upward-pointing triangle |
|
"v" | Downward-pointing triangle |
|
">" | Right-pointing triangle |
|
"<" | Left-pointing triangle |
|
"pentagram" | Pentagram |
|
"hexagram" | Hexagram |
|
| Color Name | Short Name | RGB Triplet | Appearance |
|---|---|---|---|
"red" | "r" | [1 0 0] |
|
"green" | "g" | [0 1 0] |
|
"blue" | "b" | [0 0 1] |
|
"cyan"
| "c" | [0 1 1] |
|
"magenta" | "m" | [1 0 1] |
|
"yellow" | "y" | [1 1 0] |
|
"black" | "k" | [0 0 0] |
|
"white" | "w" | [1 1 1] |
|
Output Arguments
Tips
When you pass two points to the plotm function, the function
projects the locations of each point on the map and displays a straight line that
connects them, regardless of the map projection or the distance between the points. To
display a projected geodesic or rhumbline curve between two points, first insert
intermediate points using the track2 function.
Version History
Introduced before R2006a