Create Your First World Map
R2026bGeospatial data can be complex and difficult to process. Mapping Toolbox™ functions handle many of the details of loading, representing, and displaying spatial data. Spatial data describes location, shape, and spatial relationships. Geospatial data is spatial data that is georeferenced, or tied to, specific locations on, under, or above the surface of a planet.
This page shows how to create similar world maps using map axes (since R2023a) and axesm-based maps. For a comparison of map axes and axesm-based maps, including when to use each type of display, see Choose a 2-D Map Display.
Load Data
Load data to use in the examples.
Read four shapefiles into the workspace by using the readgeotable function.
World land areas, represented as polygons in geographic coordinates.
Land areas for the northern hemisphere, represented as polygons in geographic coordinates.
World rivers, represented as lines in geographic coordinates.
World cities, represented as points in geographic coordinates.
land = readgeotable("landareas.shp");
nhland = readgeotable("northernhemisphere.shp");
rivers = readgeotable("worldrivers.shp");
cities = readgeotable("worldcities.shp");
Load a MAT file containing the coordinates of global coastlines. The variables within the MAT file, coastlat and coastlon, specify numeric latitude and longitude coordinates, respectively.
load coastlinesCreate Map Using Map Axes
Create a world map using a map axes object.
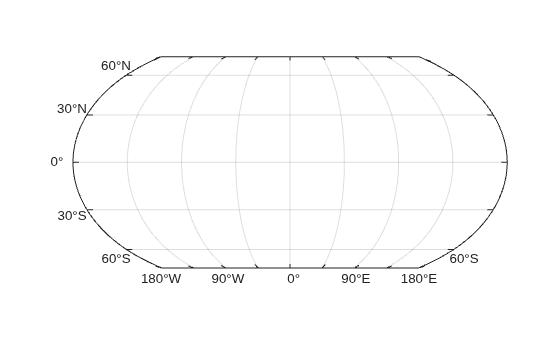
Set up a new map by using the newmap function. By default, map axes objects use an Equal Earth projection centered on the prime meridian and the equator.
figure
newmap
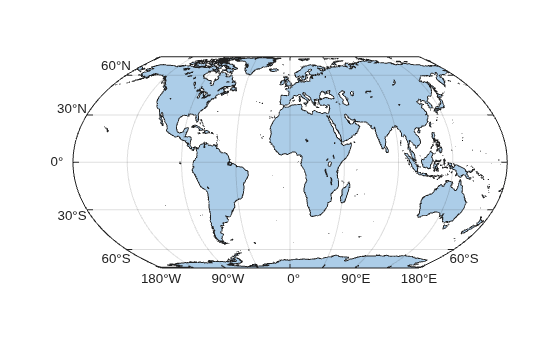
Display the land areas using the geoplot function.
geoplot(land)
You can also create map axes for smaller regions. Set up a map of Europe by specifying a placename as input to the newmap function. The function selects a projection that is appropriate for the region.
figure
newmap("Europe")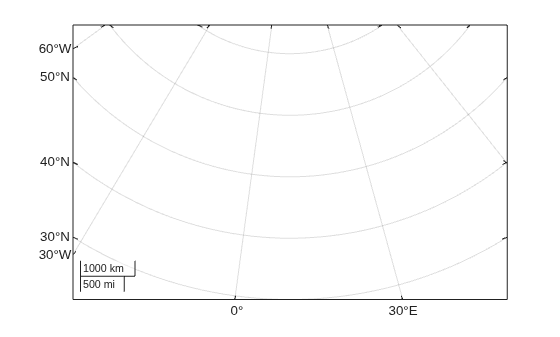
Display the land areas for the northern hemisphere as green polygons, the rivers as blue lines, and the cities as red points.
geoplot(nhland,FaceColor=[0.65 0.85 0.45])
hold on
geoplot(rivers,Color=[0 0.4470 0.7410])
geoplot(cities,MarkerEdgeColor=[0.6350 0.0780 0.1840])
Label the Atlantic Ocean. Specify the location of the text using latitude and longitude coordinates.
text(41,-30,"Atlantic Ocean")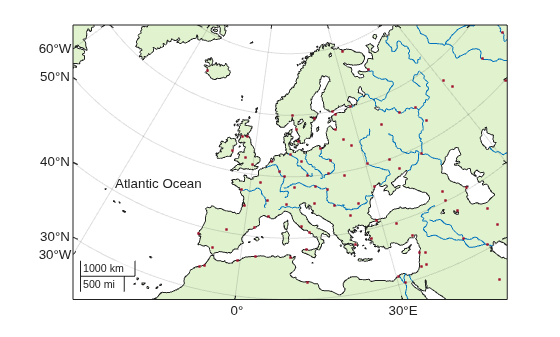
You can also use map axes to create maps in any supported projected coordinate reference system (CRS). Specify the projected CRS using a projcrs object. For an example, see Create Map Axes from Projected CRS on the newmap reference page.
Create Map Using axesm-Based Map
Create a world map using an axesm-based map.
Set up a map of the world by using the worldmap function. The function automatically selects the map projection and the coordinate limits based on the region you specify. When you specify the region as world, the function selects a Robinson projection centered on the prime meridian and the equator.
figure
worldmap world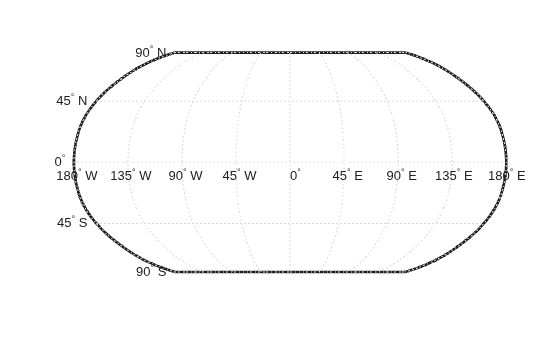
Display the coastline data using the plotm function.
load coastlines
plotm(coastlat,coastlon)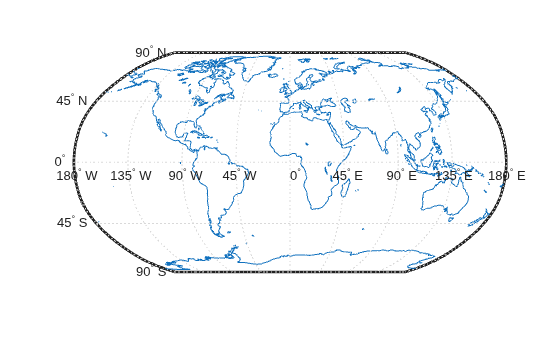
You can also create axesm-based maps for smaller regions. Set up a map of Europe by using the worldmap function.
figure
worldmap europe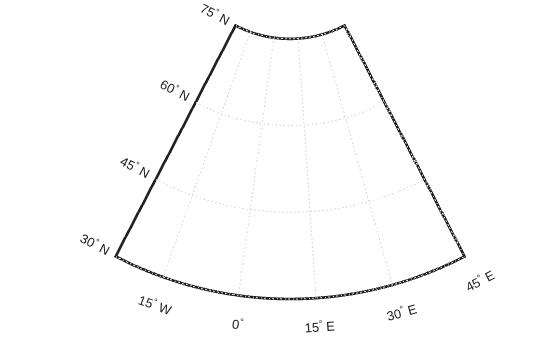
In addition to standard axes properties, axesm-based maps contain properties such as the map projection type, the projection parameters, and the map limits. You can access and modify these additional properties using by using the getm and setm functions.
Query the map projection used by the map. The result indicates that the map uses an Equidistant Conic projection.
ax = gca;
getm(ax,"MapProjection")
ans = 'eqdconic'
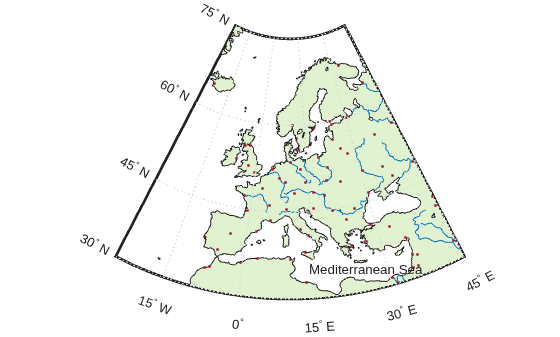
Display the data by using the geoshow function. Display the land areas for the northern hemisphere as green polygons, the world rivers as blue lines, and the world cities as red points.
geoshow(nhland,FaceColor=[0.88 0.95 0.81])
geoshow(rivers,Color=[0 0.4470 0.7410])
geoshow(cities,Marker=".",MarkerEdgeColor=[0.6350 0.0780 0.1840])
Label the Mediterranean Sea by using the textm function. Specify the location of the text using latitude and longitude coordinates.
textm(35,14,"Mediterranean Sea")