newmap
Description
newmap creates the default map axes in the current figure. By
default, the function creates a world map that uses an Equal Earth projection.
In some cases, the newmap function can change the current figure
and current axes. For more information, see Algorithms.
newmap( changes or
replaces the axes specified by target,___)target instead of the current axes, in
addition to any combination of inputs from the previous syntaxes.
mx = newmap(___) returns the MapAxes
object. Use mx to query and modify properties of the
MapAxes object after creation. For a list of properties, see MapAxes Properties.
Examples
Create the default map axes. By default, the map axes uses an Equal Earth projection.
newmap
Read a shapefile containing world land areas into the workspace as a geospatial table. Display the land areas on the map axes.
land = readgeotable("landareas.shp");
geoplot(land)
MapAxes objects use projected coordinate reference systems (CRSs) to transform geographic (latitude-longitude) coordinates to projected (xy) coordinates. There are two ways to get a projected CRS:
Get a projected CRS from a data file.
Create a projected CRS object by using the
projcrsfunction. You can create a projected CRS object from an authority code or from a well-known text string.
Get Projected CRS from File
Read a shapefile of road data into the workspace as a geospatial table. The table represents the roads using line shapes in projected coordinates.
roads = readgeotable("concord_roads.shp");Extract the projected CRS from the data file. Then, create a map axes that uses the projected CRS.
proj1 = roads.Shape.ProjectedCRS;
newmap(proj1)
Display the data on the map axes.
geoplot(roads)

Get Projected CRS from Authority Code
Geocode the state of Alaska. The output is a geospatial table that represents Alaska using a polygon shape in geographic coordinates.
alaska = geocode("Alaska");Create a projected CRS object appropriate for Alaska. Use the Alaska Albers Equal Area Conic projected CRS, which has the ESRI code 102006. Then, create a map axes that uses the projected CRS.
proj2 = projcrs(102006,Authority="ESRI");
newmap(proj2)
Display the Alaska polygon on the map axes.
geoplot(alaska)
geolimits([48 72],[-180 -135])

Import a shapefile containing road data for Concord, MA into the workspace as a geospatial table. The table represents roads using line shapes in projected coordinates.
roads = readgeotable("concord_roads.shp");Create a map axes that uses the projected CRS embedded in the data file. Return the MapAxes object as a variable.
proj = roads.Shape.ProjectedCRS;
mx = newmap(proj);

Customize the map by setting properties of the MapAxes object. Set the tick label format to decimal degrees, remove the graticule lines, and change the outline color.
mx.TickLabelFormat = "dd";
mx.GraticuleLineStyle = "none";
mx.OutlineColor = "r";

Read a shapefile of US states into the workspace as a geospatial table. The table represents the states using polygon shapes in geographic coordinates. Remove the table rows representing Alaska and Hawaii.
states = readgeotable("usastatehi.shp");
idx = states.Name ~= "Alaska" & states.Name ~= "Hawaii";
states = states(idx,:);
Create a 2-by-1 tiled chart layout.
In the first tile, display the US states over a map axes that uses a North America Albers Equal Area Conic projection.
In the second tile, display the US states over a geographic axes, which uses a Web Mercator projection.
tiledlayout(2,1)

nexttile
proj = projcrs(102008,Authority="ESRI");
newmap(proj)
geoplot(states)

nexttile
geoplot(states)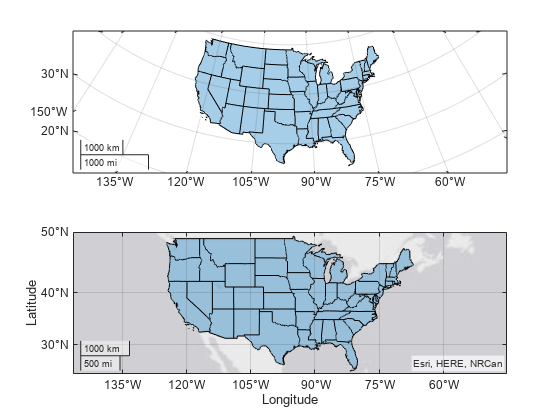
Input Arguments
Tips
If you want advanced control of the map axes, or you want to include the map axes in an
app, use the mapaxes
function.
Algorithms
The behavior of the newmap function depends on the
NextPlot properties of the figure and axes.
First, the newmap function queries the NextPlot property of the figure.
If you specify the
targetinput argument, then the function uses the figure associated withtarget.If you do not specify the
targetinput argument, then the function uses the current figure. If there is no current figure, then the function creates a new figure.
This table shows how the newmap function changes the
figure based on the value of NextPlot.
Value of | Behavior of |
|---|---|
| The
|
| If you do not specify If you specify |
| The
This behavior is similar to using the |
| The
This behavior is similar to using the |
Then, the newmap function queries the NextPlot
property of the axes in the figure.
If you specify the
targetinput argument as an axes, then the function usestarget.If you do not specify the
targetinput argument, then the function uses the current axes. If there is no current axes, then the function creates a newMapAxesobject.
This table shows how the newmap function changes the axes based on
the value of NextPlot.
Value of | Behavior of |
|---|---|
| When the axes is a
When the axes is not a This behavior is similar to using the
|
| When the axes is a
When the axes is not a |
| When the axes is a
When the axes is not a This behavior is similar to using the
|
| When the axes is a
When the axes is not a This behavior is similar to using the
|
Version History
Introduced in R2023a