plotTrack
Display object tracks on bird's-eye plot
Syntax
Description
plotTrack(
displays object tracks from a list of object positions on a bird's-eye plot. The
track plotter, tPlotter,positions)tPlotter, is associated with a birdsEyePlot object and
configures the display of the object tracks.
To remove all tracks associated with track plotter
tPlotter, call the clearData function and specify tPlotter as
the input argument.
plotTrack(
displays tracks and their velocities on a bird's-eye plot.tPlotter,positions,velocities)
plotTrack(
displays tracks and the covariances of track uncertainties on a bird's-eye
plot.tPlotter,positions,covariances)
plotTrack(
displays tracks and their velocities, labels, and covariances on a bird's-eye
plot. You can specify one or more of tPlotter,positions,velocities,labels,covariances)velocities,
labels, and covariances. These
arguments can appear in any order but they must come after
tPlotter and positions.
Examples
Create a bird's-eye plot with an x-axis range from 0 to 90 meters and a y-axis range from –35 to 35 meters. Create a track plotter that displays up to seven history values for each track and offsets labels by 3 meters in front of the tracks.
bep = birdsEyePlot('XLim',[0 90],'YLim',[-35 35]);
tPlotter = trackPlotter(bep,'DisplayName','Tracks','HistoryDepth',7,'LabelOffset',[3 0]);

Set the positions and velocities of three labeled tracks.
positions = [30, 5; 30, 5; 30, 5];
velocities = [3, 0; 3, 2; 3, -3];
labels = {'T1','T2','T3'};
Display the tracks for 10 trials. The bird's-eye plot shows the seven history values specified previously.
for i=1:10
   plotTrack(tPlotter,positions,velocities,labels);
   positions = positions + velocities;
end

Input Arguments
Track plotter, specified as a TrackPlotter object. This
object is stored in the Plotters property of a birdsEyePlot object and
configures the display of the specified tracks in the bird's-eye plot. To
create this object, use the trackPlotter
function.
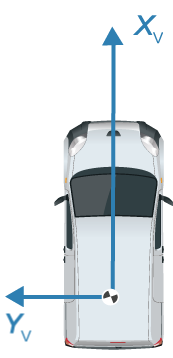
Positions of tracked objects in vehicle coordinates, specified as an M-by-2 real-valued matrix of (X, Y) positions. M is the number of tracked objects. The positive X-direction points ahead of the center of the vehicle. The positive y-direction points to the left of the origin of the vehicle, which is the center of the rear axle, as shown in this figure of the vehicle coordinate system.
Velocities of tracked objects, specified as an M-by-2 real-valued matrix of velocities in the (X, Y) direction. M is the number of tracked objects. The velocities are plotted as line vectors that originate from the center positions of the tracked objects.
Track labels, specified as an M-length string array or
an M-length cell array of character vectors.
M is the number of tracked objects. The labels
correspond to the locations in the positions matrix. By
default, tracks do not have labels. To remove all annotations and labels
associated with the track plotter, use the clearData function.
Covariances of track uncertainties centered at the track positions, specified as a 2-by-2-by-M real-valued array. The uncertainties are plotted as an ellipse.
Version History
Introduced in R2017a