plotpc
R2026b(To be removed) Plot classification line on perceptron vector plot
plotpc will be removed in a future release. For more information,
see Transition Legacy Neural Network Code to dlnetwork Workflows.
For advice on updating your code, see Version History.
Syntax
plotpc(W,B)

plotpc(W,B,H)
Description
plotpc(W,B) takes these inputs,
W |
|
B |
|
and returns a handle to a plotted classification line.
plotpc(W,B,H) takes an additional input,
H | Handle to last plotted line |
and deletes the last line before plotting the new one.
This function does not change the current axis and is intended to be called after
plotpv.
Examples
Plot Classification Line
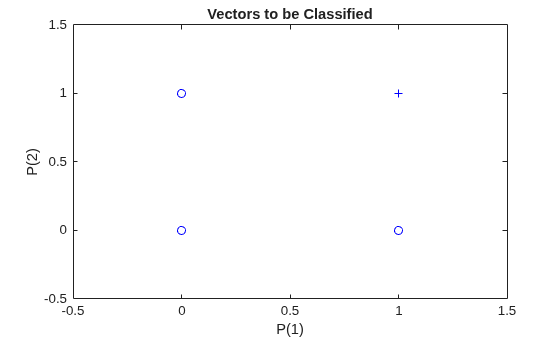
The code below defines and plots the inputs and targets for a perceptron:
p = [0 0 1 1; 0 1 0 1];
t = [0 0 0 1];
plotpv(p,t)
The following code creates a perceptron, assigns values to its weights and biases, and plots the resulting classification line.
net = perceptron;
net = configure(net,p,t);
net.iw{1,1} = [-1.2 -0.5];
net.b{1} = 1;
plotpc(net.iw{1,1},net.b{1})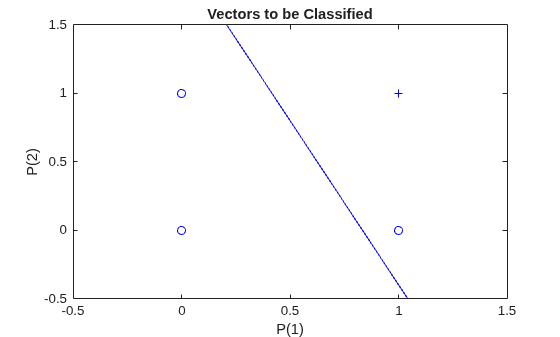
Version History
Introduced before R2006aSee Also
Time Series
Modeler | fitrnet (Statistics and Machine Learning Toolbox) | fitcnet (Statistics and Machine Learning Toolbox) | trainnet | trainingOptions | dlnetwork

