Statistics
606 Posts
RANK
N/A
of 301,738
REPUTATION
N/A
CONTRIBUTIONS
0 Questions
0 Answers
ANSWER ACCEPTANCE
0.00%
VOTES RECEIVED
0
RANK
of 21,403
REPUTATION
N/A
AVERAGE RATING
0.00
CONTRIBUTIONS
0 Files
DOWNLOADS
0
ALL TIME DOWNLOADS
0
RANK
of 176,316
CONTRIBUTIONS
0 Problems
0 Solutions
SCORE
0
NUMBER OF BADGES
0
CONTRIBUTIONS
606 Posts
CONTRIBUTIONS
0 Public Channels
AVERAGE RATING
CONTRIBUTIONS
0 Discussions
AVERAGE NO. OF LIKES
Feeds
Published
Retirement!
The time has come! After more than 30 years of software development at MathWorks, I have decided to retire. Friday, March...
2 years ago

Published
An Example of Function Argument Validation for an Image Utility Function
While I was working on a prototype yesterday, I found myself writing a small bit of code that turned out to be so useful,...
3 years ago

Published
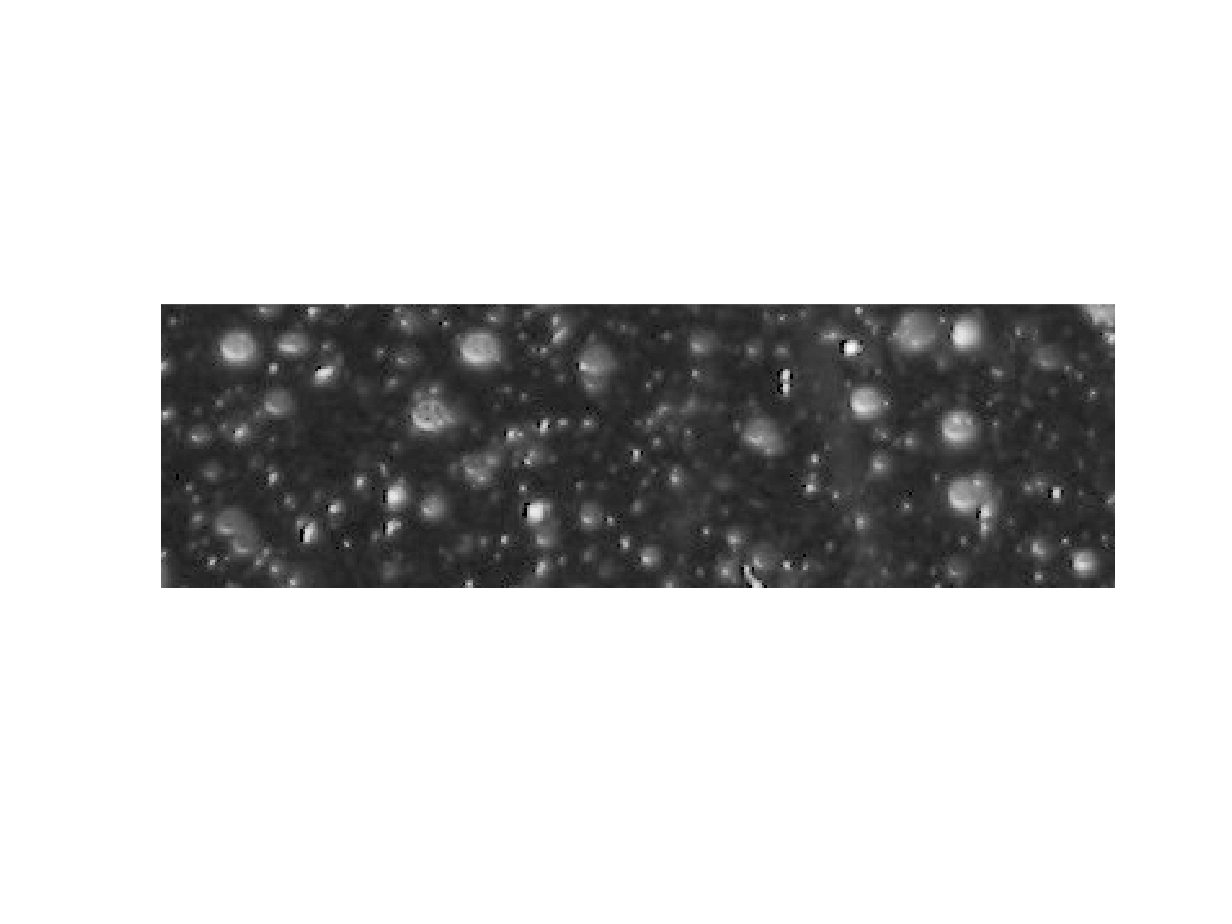
Quantitative Video Analysis: Measuring a Container Filling with Liquid
Today's post is by guest blogger Isaac Bruss. Isaac has been a course developer for MathWorks since 2019. His PhD is in...
3 years ago

Published
Revised Circularity Measurement in regionprops (R2023a)
For some shapes, especially ones with a small number of pixels, a commonly-used method for computing circularity often...
3 years ago

Published
Identifying Border-Touching Objects Using imclearborder or regionprops
I have seen some requests and questions related to identifying objects in a binary image that are touching the image...
3 years ago

Published
Object Sort Order for bwlabel, bwconncomp, and regionprops
Someone recently asked me about the order of objects found by the functions bwlabel, bwconncomp, and regionprops. In this...
3 years ago

Published
Fast Local Sums, Integral Images, and Integral Box Filtering
In May 2006, I wrote about a technique for computing fast local sums of an image. Today, I want to update that post with...
3 years ago

Published
Objects and Polygonal Boundaries
In some of my recent perusal of image processing questions on MATLAB Answers, I have come across several questions...
3 years ago

Published
Avoid Using JPEG for Image Analysis
Note added 20-Dec-2022: I wrote this post with lossy JPEG in mind. If you work with DICOM data, see Jeff Mather's note...
3 years ago

Published
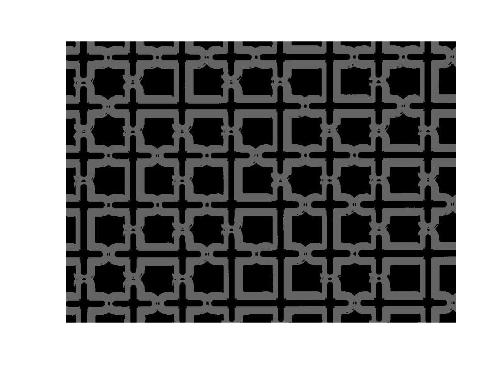
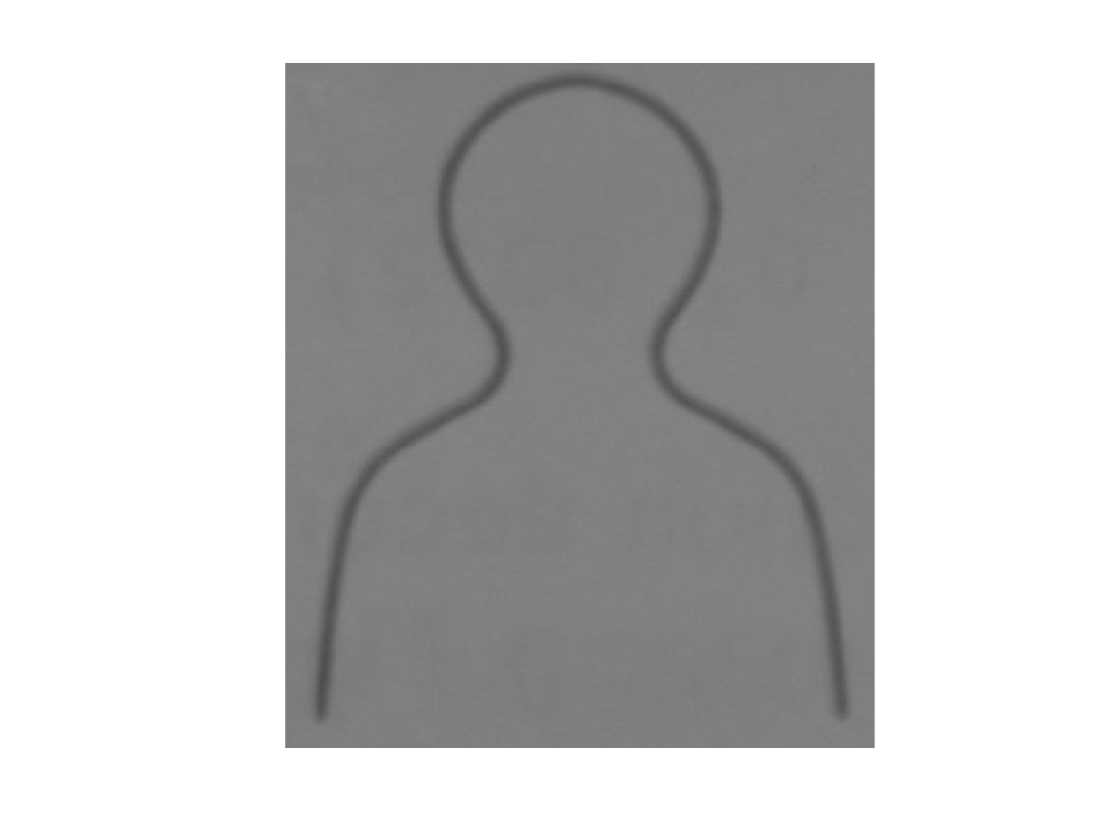
Finding the Channels
Last winter, Aktham asked on MATLAB Answers how to find the channels in this image.url =...
3 years ago
Published
Using Active Contour Automation in the Medical Image Labeler
Woo hoo! The Image Processing Toolbox team has just created a new product:Medical Imaging Toolbox™Shipped with the R2022b...
3 years ago
Published
New Geometric Transformation Matrix Convention in R2022b
In the R2022b release, Image Processing Toolbox includes several new geometric transformation objects, such as rigidtform2d,...
3 years ago
Published
Update for Code Trace for MATLAB
About a month ago, I posted about my Code Trace for MATLAB tool, which is posted to GitHub and the File Exchange. This tool...
3 years ago
Published
Double Thresholding
Back in June, my answer to a question on MATLAB Answers used a technique called double thresholding, also known as...
3 years ago
Published
Code Trace for MATLAB
Today's post departs from image processing, my usual subject. Instead, I want to tell you about something that I just put up...
3 years ago
Published
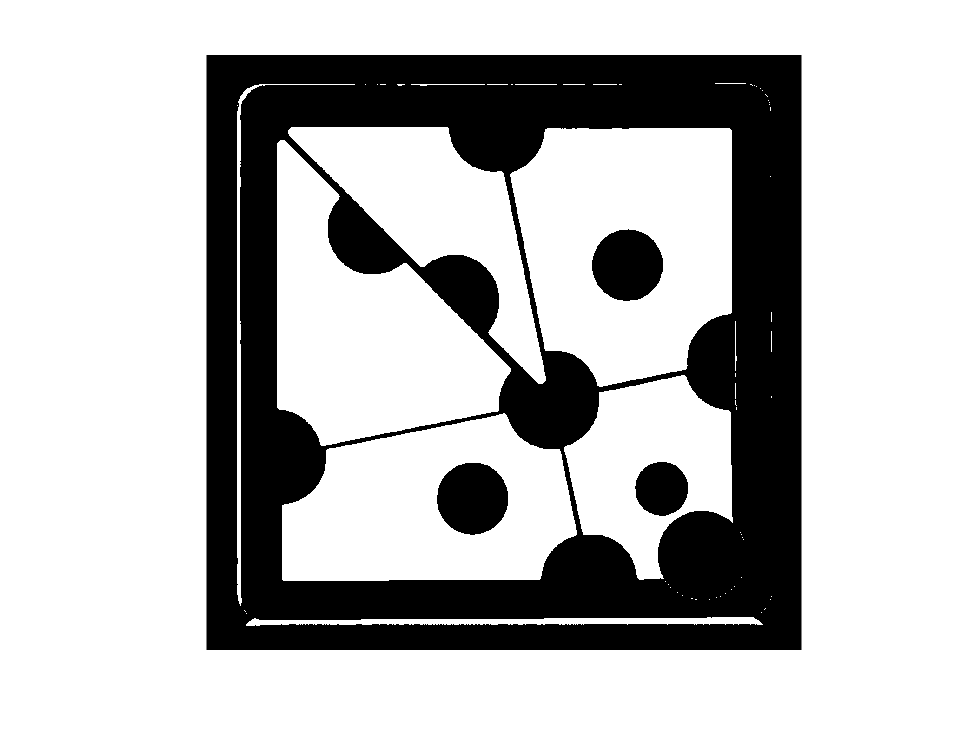
Puzzle Pieces and Polyshapes
color segmentation, opening by reconstruction, boundary tracing, polyshapesEarlier this summer, Cleve sent me this picture...
3 years ago
Published
How to use IMSPLIT to split a color image into component images
Today I want to show you a handy little function, imsplit, for splitting color images into their components.Also, for no...
4 years ago

Published
Find all the highest pixel values using ismember
Today's post shows how to use ismember to conveniently locate all of the highest pixel values in an image. For example, in...
4 years ago
Published
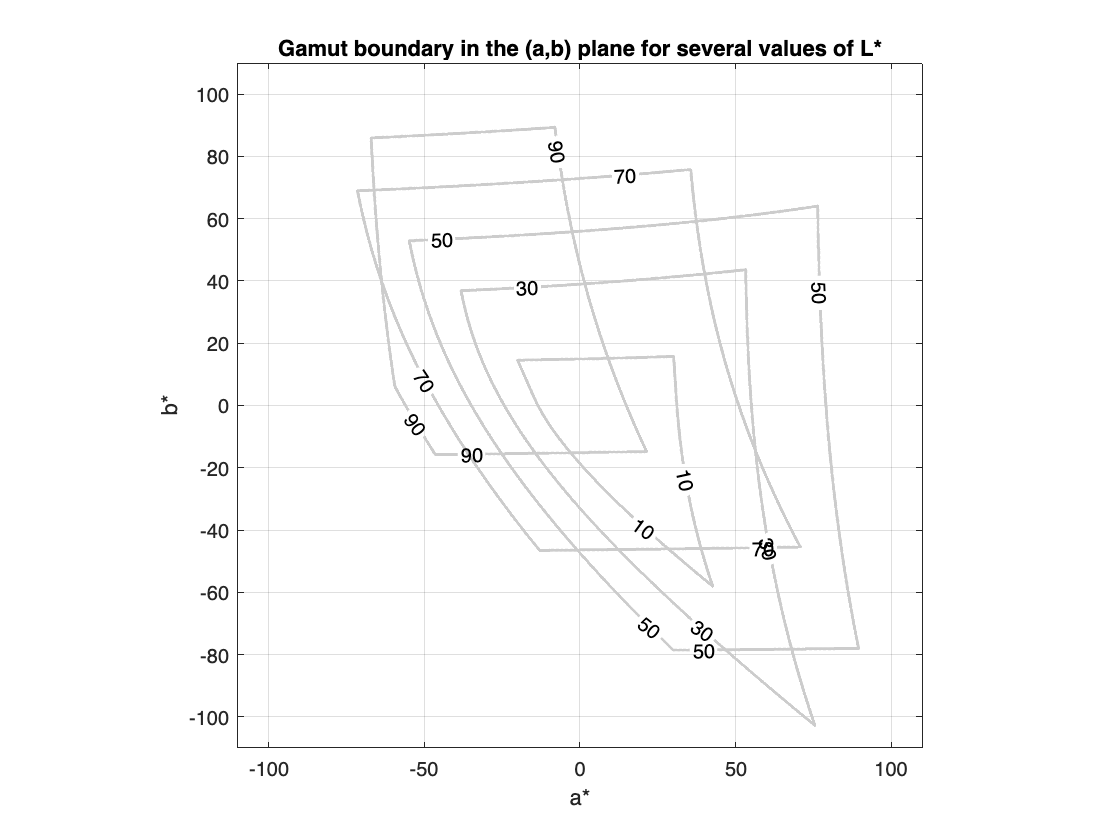
More experiments with sRGB gamut boundary in L*a*b* space
I'm still playing around with RGB gamut calculations in $ L^* a^* b^* $ space. (See my last post on this topic, "Visualizing...
4 years ago
Published
Puzzles About GIF DelayTime
[TLDR: To create a fast GIF animation using imwrite, use a DelayTime of 0.02 instead of 0.]In my 28-Feb-2022 post, I showed...
4 years ago
Published
Loren Shure and the Art (and History) of MATLAB
The one and only Loren Shure has just announced her retirement from MathWorks. I met Loren in early 1993 at the...
4 years ago

Published
R2022a
It's March, and you know what that means --- that's right, the "a" release is here!On most work days, I use several...
4 years ago
Published
A Short Game of Life
I have written here, as well as in Digital Image Processing Using MATLAB, about using image processing operations to...
4 years ago
Published
Visualizing out-of-gamut colors in a Lab curve
I was looking today at an old post, "A Lab-based uniform color scale" (09-May-2006). I wanted to provide an update to...
4 years ago

Published
Peaks, Peak Filtering, and Gray-Scale Weighted Centroids
Today, I'm continuing my recent theme of thinking about peak-finding in images. When I wrote the first one (19-Aug-2021), I...
4 years ago
Published
Small-Peak Suppression with the H-Maxima Transform
Last time, I introduced the idea of a regional maximum. Today, I want to add a concept that makes the regional maximum more...
4 years ago

Published
Local maxima, regional maxima, and the function imregionalmax
A recent algorithm discussion on the Image Processing Toolbox development team reminded me of something I originally wanted...
5 years ago

Published
Use less meshgrid and repmat
The functions meshgrid and repmat have a long and rich history in MATLAB. Today, I'll try to convince you to use them...
5 years ago
Published
Use imbinarize to Threshold Gray-Scale Images
Today, I want to convince you to use imbinarize instead of im2bw.Background: I recently saw some data suggesting that many...
5 years ago
Published
NaN Sightings
Some of us at MathWorks like to share our "NaN sightings." Here is an example to show what I mean. This is a screenshot of...
5 years ago