Results for
Hello
I am trying to connect Thingspeak to ibfluxdb. Is that possible? how you do that??
We will be updating the MATLAB Answers infrastructure at 1PM EST today. We do not expect any disruption of service during this time. However, if you notice any issues, please be patient and try again later. Thank you for your understanding.
I am using a micro:bit device with ESP8266 for a IOT project, but cannot connect thingspeak recently.
The conncection is unstable, I can hardly connect to thingspeak for days, somehow it works last night for 30 mins and then it fails.
The program does not change and I have included a 25 sec delayed between each data sending.
Please advice why and how to fix it. Thank you.
I am using the ELECFREAKS IOT:bit Expansion Board with micro:bit to record data, it worked normally but in this week I tested again, and discover no data is uploaded to the channel ie.no entries in channel. The code in makecode are the same as before and the wifi is work, I cannot find the reason that cause this failure.
I am using the free option with 4 channels available. I do not have any channels listed, but when I want to create a new channel it gives me an error massage to say that I have used up my 4 channels and need to purchase units to create additional channels.
Hello, MATLAB fans!
For years, many of you have expressed interest in getting your hands on some cool MathWorks merchandise. I'm thrilled to announce that the wait is over—the MathWorks Merch Shop is officially open!

In our shop, you'll find a variety of exciting items, including baseball caps, mugs, T-shirts, and YETI bottles.
Visit the shop today and explore all the fantastic merchandise we have to offer. Happy shopping!
Hello
I have 3 devices (IOT board using SIM7600 module) sending one value to Thingsspeak. Have been working just fine a couple of years. However 14/11-24 I receive http error code 406 for all 3 devices.
The http get is working just fine when testing directly in the browser (https://api.thingspeak.com/update?api_key=xxxxx&field1=33), the server return the entrie number.
However, when running the same address via SIM7600 I receive - +HTTPACTION: 0,406,0
Any tips for the 406 error code?
Hello, I am wondering why I have over 12000 messages (writes)per day to a channel which I only update all 8 fields every 20 minutes. Or are these statistic timely delayed? Since testing I might have more writes, but now with my ready weather station only every 20 minutes my data will be updated. Wetterbox Channel ID: 2391212 Access: Public Can you explain this to me? Thank you for your help. Regards, Julian
What incredible short movies can be crafted with no more than 2000 characters of MATLAB code? Discover the creativity in our GALLERY from the MATLAB Shorts Mini Hack contest.
Vote on your favorite short movies by Nov.10th. We are giving out MATLAB T-shirts to 10 lucky voters!

Tips: the more you vote, the higher your chance to win.
Mark your calendar for November 13–14 and get ready for two days of learning, inspiration, and connections!
We are thrilled to announce that MathWork’s incredible María Elena Gavilán Alfonso was selected as a keynote speaker at this year’s MATLAB Expo.
Her session, "From Embedded to Empowered: The Rise of Software-Defined Products," promises to be a game-changer! With her expertise and insights, María is set to inspire and elevate our understanding of the evolving world of software-defined products.

I am considering to upgrade to HOME license. Does the HOME license provides more widgets (including a text message widget), in addition to the 4 basic widgets in the FREE version?
Hi,
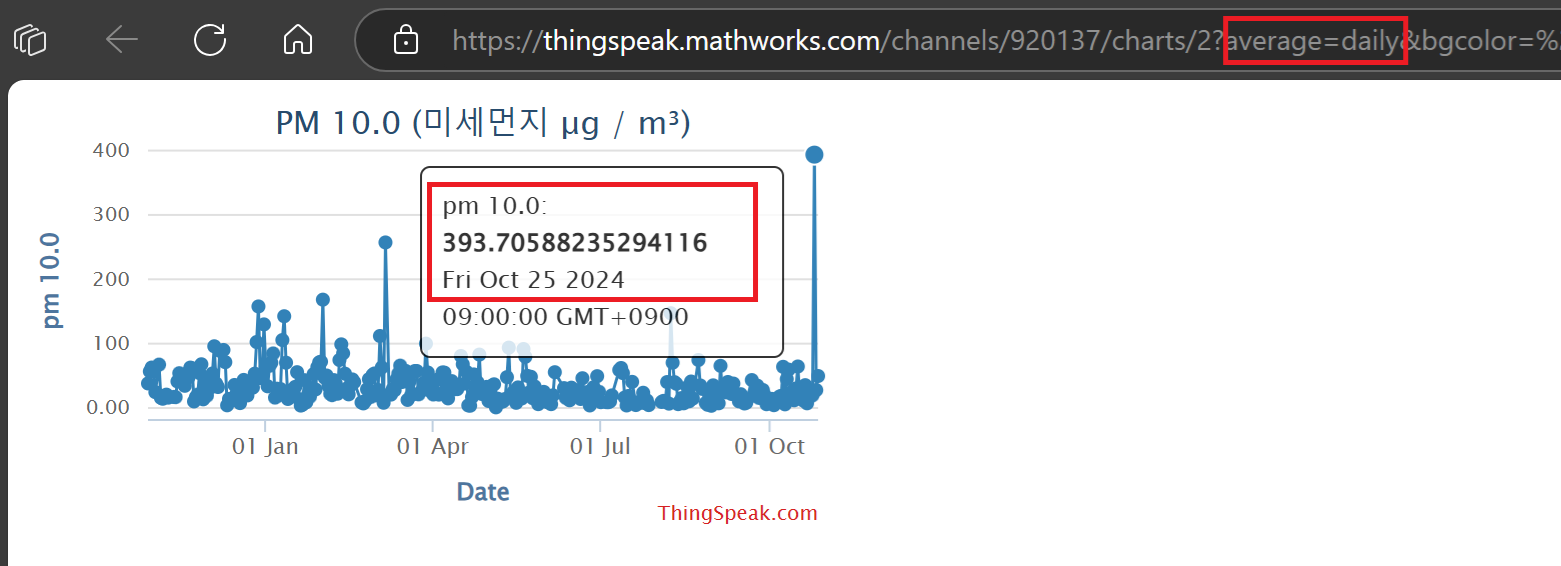
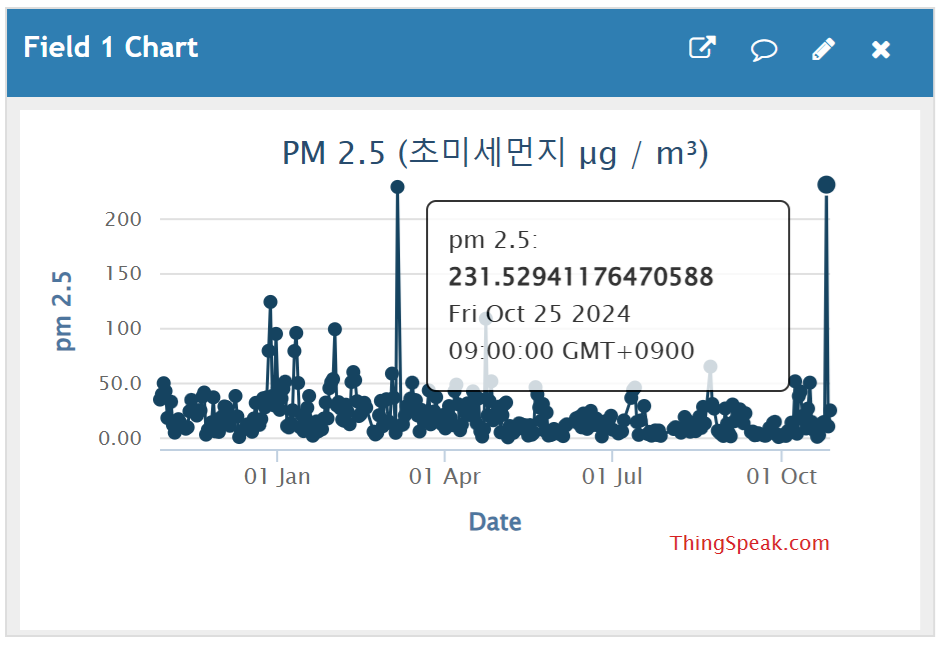
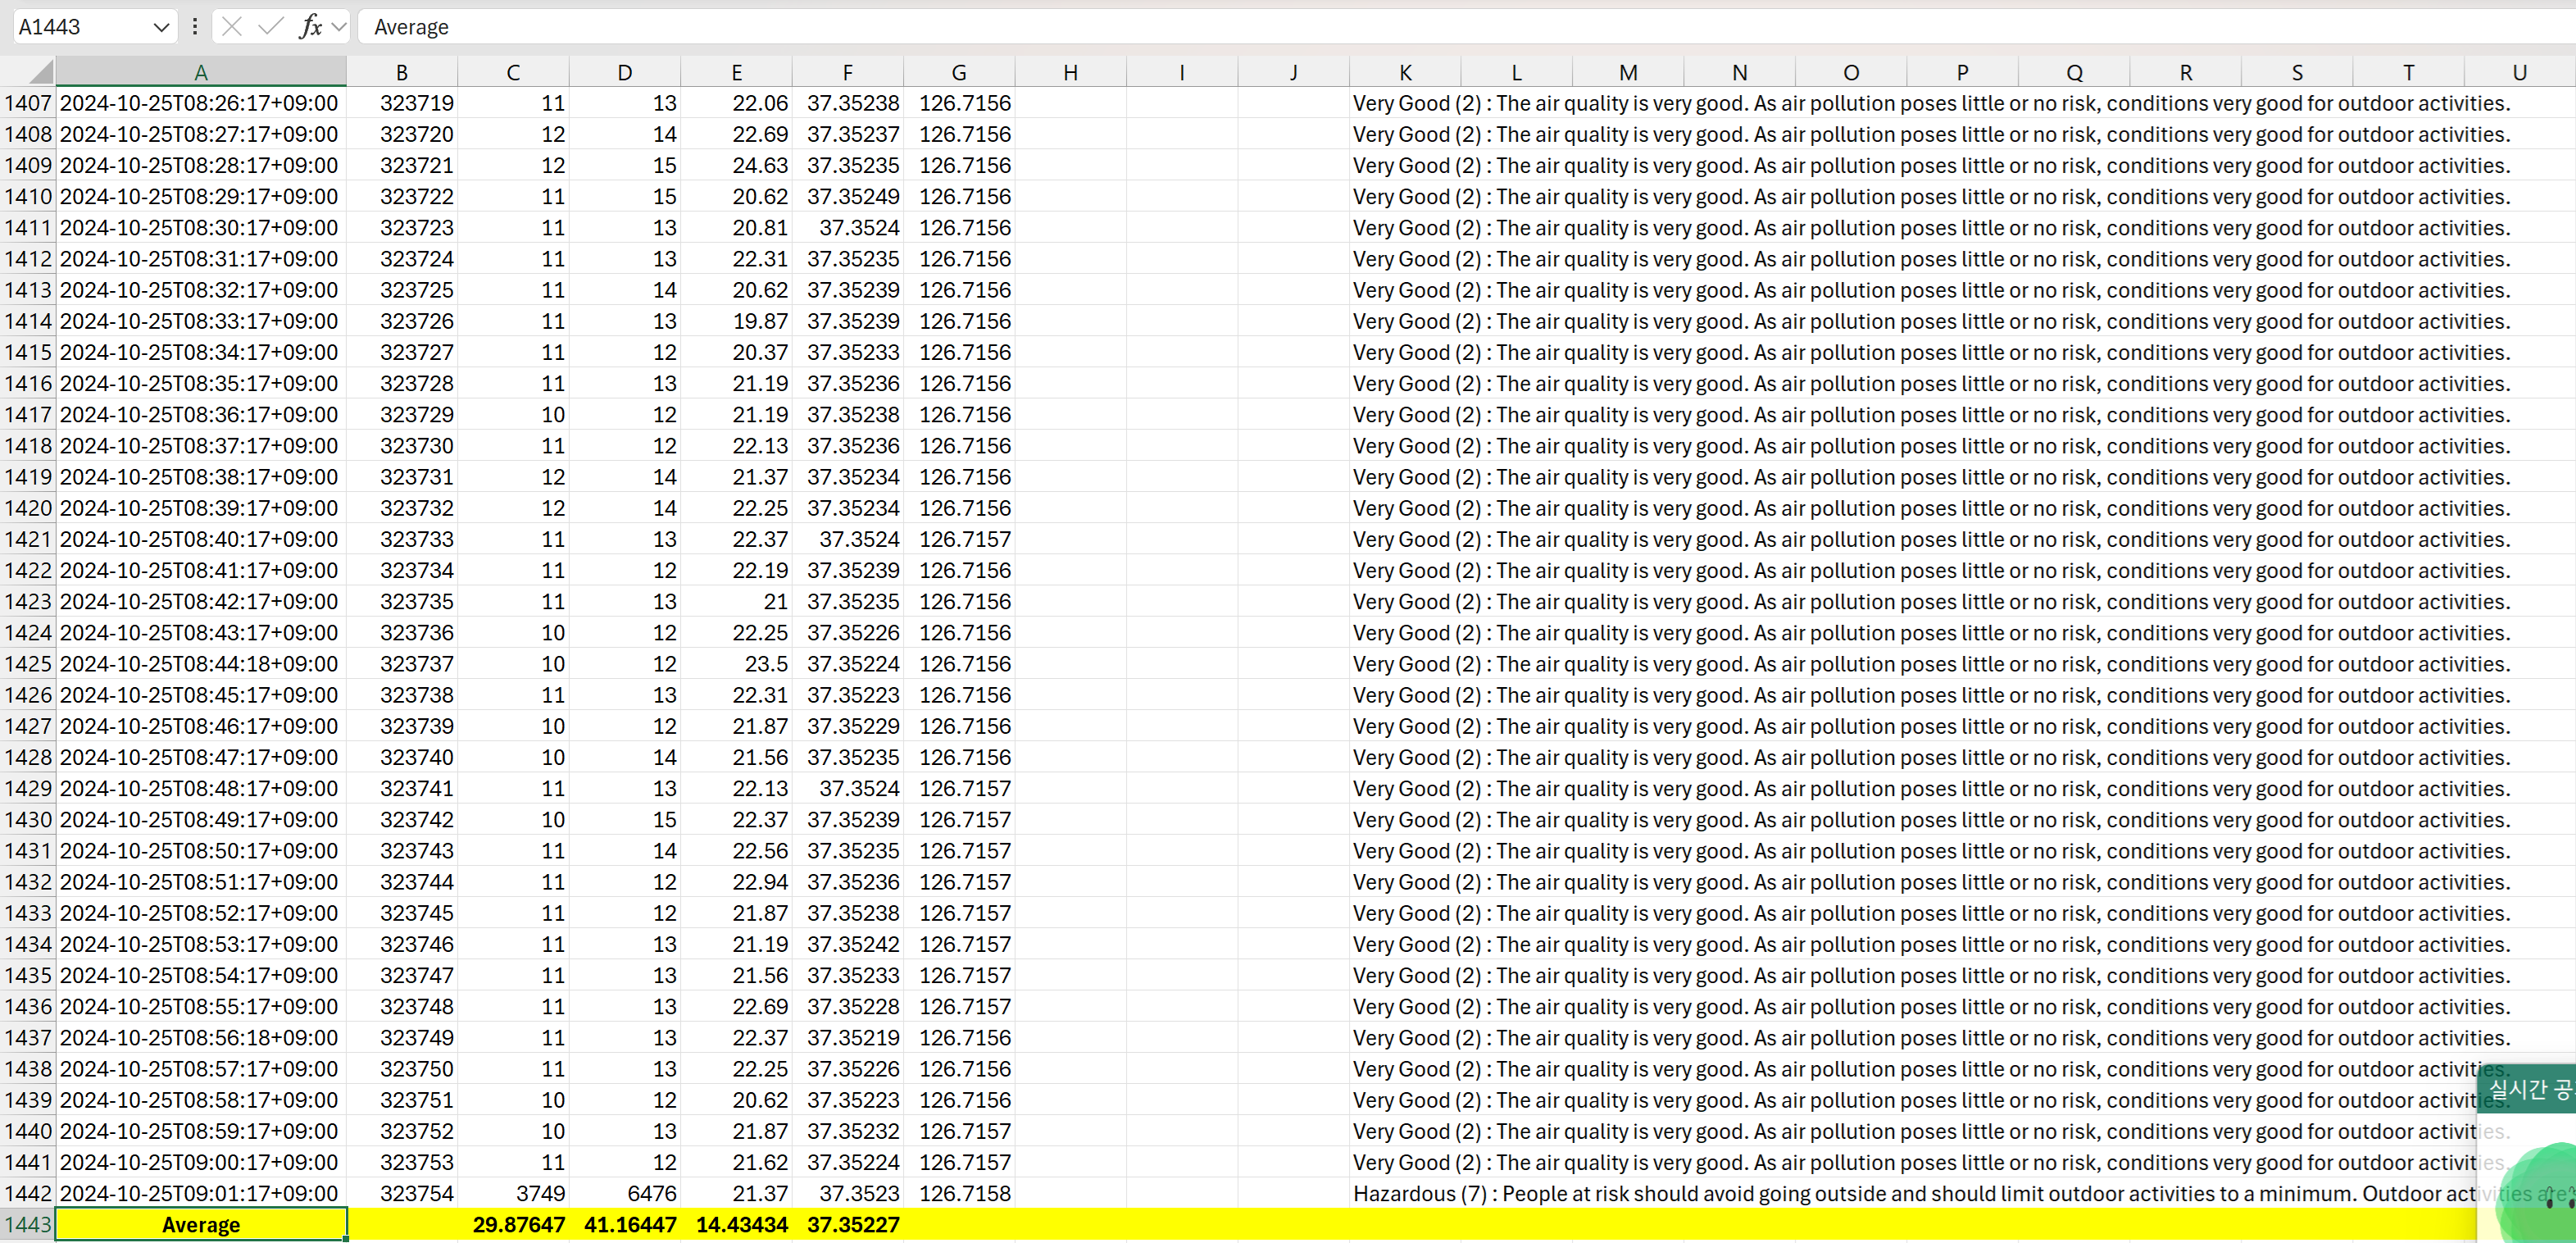
I don't know why really. Why is there seems a difference between daily average that calculated with .csv file that has exported directly from the channel.
and calculation with the ThingSpeak Daily Average API, there is a lot of difference at the moment.
Why does this happens, and how should I fix this issue?
Attached image file is daily average that has been retrived through the API,
And attached excel file is raw data from the channel.
Thank you.
Welcome to the launch of our new blog area, Semiconductor Design and Verification! The mission is to empower engineers and designers in the semiconductor industry by streamlining architectural exploration, optimizing the post-processing of simulations, and enabling early verification with MATLAB and Simulink.
Meet Our Authors
We are thrilled to have two esteemed authors:
@Ganesh Rathinavel and @Cristian Macario Macario have both made significant contributions to the advancement of Analog/Mixed-Signal design and the broader communications, electronics, and semiconductor industries. With impressive engineering backgrounds and extensive experience at leading companies such as IMEC, STMicroelectronics, NXP Semiconductors, LSI Corporation, and ARM, they bring a wealth of knowledge and expertise to our blog. Their work is focused on enhancing MathWorks' tools to better align with industry needs.
What to Expect
The blog will cover a wide range of topics aimed at professionals in the semiconductor field, providing insights and strategies to enhance your design and verification processes. Whether you're looking to streamline your current workflows or explore cutting-edge methodologies, our blog is your go-to resource.
Call to Action
We invite all professionals and enthusiasts in the semiconductor industry to follow our blog posts. Stay updated with the latest trends and insights by subscribing to our blog.
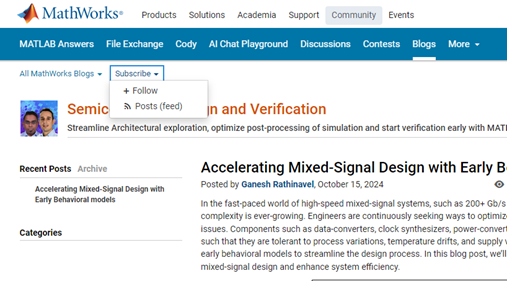
Don’t miss the first post: Accelerating Mixed-Signal Design with Early Behavioral Models, where they explore how early behavioral modeling can accelerate mixed-signal design and enhance system efficiency.
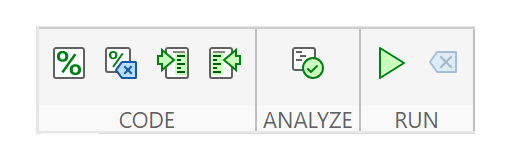
We are happy to announce the addition of a new code analyzing feature to the AI Chat Playground. This new feature allows you to identify issues with your code making it easier to troubleshoot.
How does it work?
Just click the ANALYZE button in the toolbar of the code editor. Your code is sent to MATLAB running on a server which returns any warnings or errors, each of which are associated to a line of code on the right side of the editor window. Hover over each line marker to view the message.
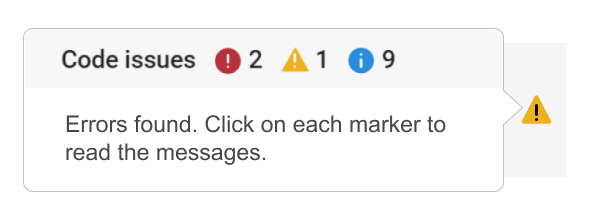
Give it a try and share your feedback here. We will be adding this new capability to other community areas in the future so your feedback is appreciated.
Thank you,
David
My Licensed avvount has expired. When I go to my expired license page, I select "Revert To Free Account", I get the following message:
Only administrators of this license are allowed to renew units on this ThingSpeak license. If you want to continue to collect data in your ThingSpeak channels, contact your license administrator.
Aren't I the license administrator? or do I need to contact someone at Thingspeak/MathWorks?
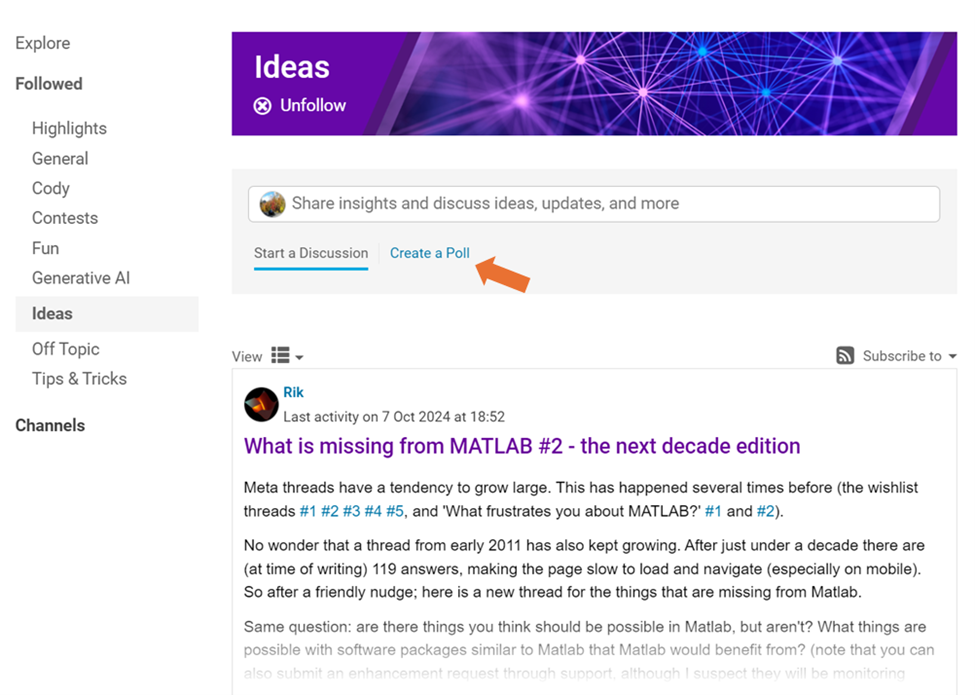
We are thrilled to announce that every community member now has the ability to create a poll in Discussions, allowing you to gather votes and opinions from the community.
How to create a poll:
You can find the ‘Create a Poll’ link just below the text box (see screenshot below). Please note that the default type of content is a ‘Discussion’. To start a poll, simply click the link.
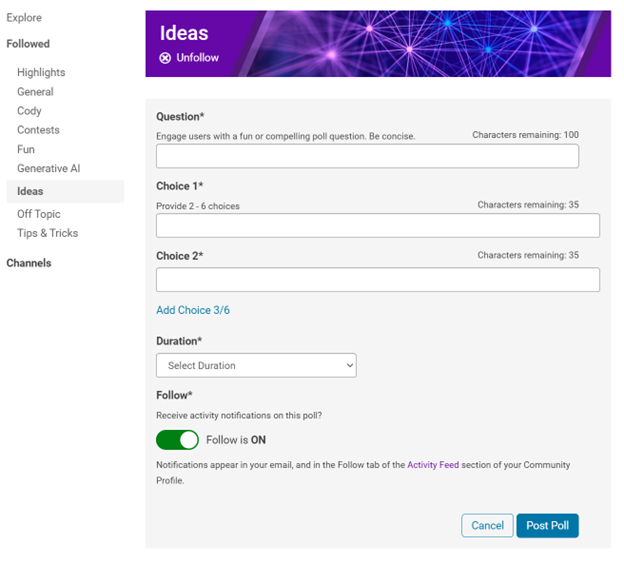
Creating a poll is straightforward. You can add up to 6 choices for your poll and set the duration from 1 to 6 weeks.
Where to find the poll
Polls created by community members will appear only in the channel where they are created and the landing page of Discussions area. Discussions moderators have the privilege to feature/broadcast the poll across Answers, File Exchange, and Cody.
Thoughts?
We can’t wait to see what interesting polls our community will create. Meanwhile, if you have any questions or suggestions, feel free to leave a comment.
Hi, My data send to thingspeak is not received/updated for the last 6 hours on the charts and dials. All worked well till about 6 hour ago. I am using Node-red and the API Url: https://thingspeak.com
Any help please?
Greetings Gert
To solve issues around the browsers blocking 3p cookies and having different behavior across different browsers, the ThingSpeak website is now served from https://thingspeak.mathworks.com. There are no changes required from devices or users. Just log in and use the service as you always did.
If you are interested in AI, Autonomous Systems and Robotics, and the future of engineering, don't miss out on MATLAB EXPO 2024 and register now.
You will have the opportunity to connect with engineers, scientists, educators, and researchers, and new ideas.
Featured Sessions:
- From Embedded to Empowered: The Rise of Software-Defined Products - María Elena Gavilán Alfonso, MathWorks
- The Empathetic Engineers of Tomorrow - Dr. Darryll Pines, University of Maryland
- A Model-Based Design Journey from Aerospace to an Artificial Pancreas System - Louis Lintereur, Medtronic Diabetes
Featured Topics:
- AI
- Autonomous Systems and Robotics
- Electrification
- Algorithm Development and Data Analysis
- Modeling, Simulation, Verification, Validation, and Implementation
- Wireless Communications
- Cloud, Software Factories, and DevOps
- Preparing Future Engineers and Scientists

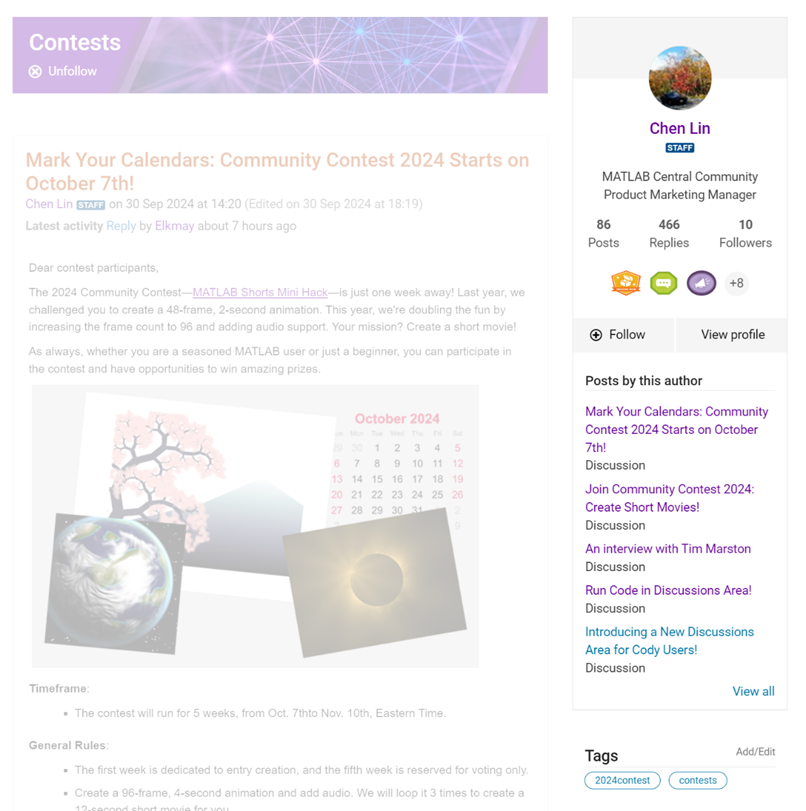
We are thrilled to announce the redesign of the Discussions leaf page, with a new user-focused right-hand column!
Why Are We Doing This?
- Address Readers’ Needs:
Previously, the right-hand column displayed related content, but feedback from our community indicated that this wasn't meeting your needs. Many of you expressed a desire to read more posts from the same author but found it challenging to locate them.
With the new design, readers can easily learn more about the author, explore their other posts, and follow them to receive notifications on new content.
- Enhance Authors’ Experience:
Since the launch of the Discussions area earlier this year, we've seen an influx of community members sharing insightful technical articles, use cases, and ideas. The new design aims to help you grow your followers and organize your content more effectively by editing tags. We highly encourage you to use the Discussions area as your community blogging platform.
We hope you enjoy the new design of the right-hand column. Please feel free to share your thoughts and experiences by leaving a comment below.