Results for
Participants across all skill levels are welcome to join! You can participate by creating a new animation or remixing an existing one with up to 2,000 characters of MATLAB code.
Contest Tips:
- Before you start, we highly recommend you check out the two examples - Bouncing and Spinning - to understand how the contest works.
- Share your thoughts, ask questions, or connect with others in our contest discussion channel.
Note that the first week (Nov. 6th, 2023, ~ Nov. 12th, 2023) is for creating entries only. Voting does not begin until the second week.
We look forward to seeing your creative work. Let the contest begin!
You are invited to join our 2023 community contest – MATLAB Flipbook Mini Hack! This year’s contest revolves around creating interesting animations using MATLAB.
Whether you are a seasoned MATLAB user or just getting started, this contest offers a fantastic opportunity to showcase your skills, learn from others, and engage with the vibrant MATLAB Central community.
Timeframe
This contest runs for 4 weeks from Nov. 6th to Dec. 3rd.
How to play
- Create a new animation or remix an existing one with up to 2,000 characters of code.
- Simply vote on the animations you love!
Prizes
You will have opportunities to win compelling prizes, including Amazon gift cards, MathWorks T-shirts, and virtual badges. We will give out both weekly prizes and grand prizes.


The MATLAB Central Community team
Hi All,
I'm currently attempting to implement a Hodgkin-Huxley-type model of membrane potential, ideally I would like a species that represents the membrane potential as its own distinct entity, so as the reference elsewhere. I've currently established a molarity-based work around but it would be great if I could set the units for the species as millivolt, but that throws an error.
Is there an established way to do this? I imagine I'm not the first person to be trying to model a voltage-gated ion channel!
Thank you for your help.
Here's a MATLAB class I wrote that leverages the MATLAB Central Interface for MATLAB toolbox, which in turn uses the publicy available Community API. Using this class, I've created a few Favorites that show me what's going on in MATLAB Central - without having to leave MATLAB 🙂
The class has a few convenient queries:
- Results for the last 7 days
- Results for the last 30 days
- Results for the current month
- Results for today
And supporting a bunch of different content scopes:
- All MATLAB Central
- MATLAB Answers
- Blogs
- Cody
- Contests
- File Exchange
- Exclude Answers content
The results are displayed in the command window (which worked best for me) and link to each post. Here's what that looks like for this command
>> CommunityFeed.thisMonth("app designer", CommunityFeed.Scope.ExcludeAnswers)
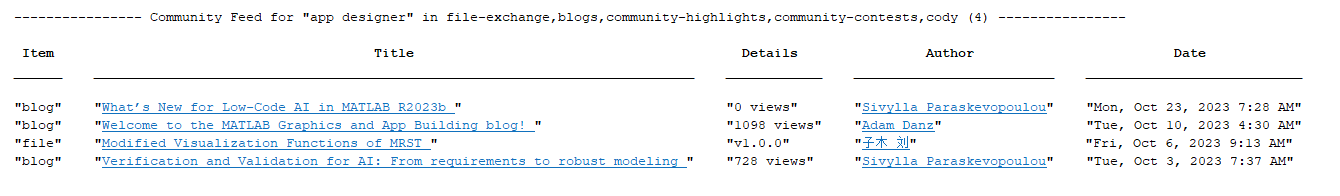
Let me know if you find this class useful and feel free to suggest changes.
Hello,
I've looked around and I haven't found anything obvious about this, but is it possible to link to species/reactions, graphically, in a non-mass transfer sense? I have areas in my model where it would conceptually make sense to be able to see that species or reactions are linked, but if I link them in the standard way it demands that it be involved in the stoichiometry.
Perhaps some kind of dotted line, or similar?
Thank you, best regards,
Dan
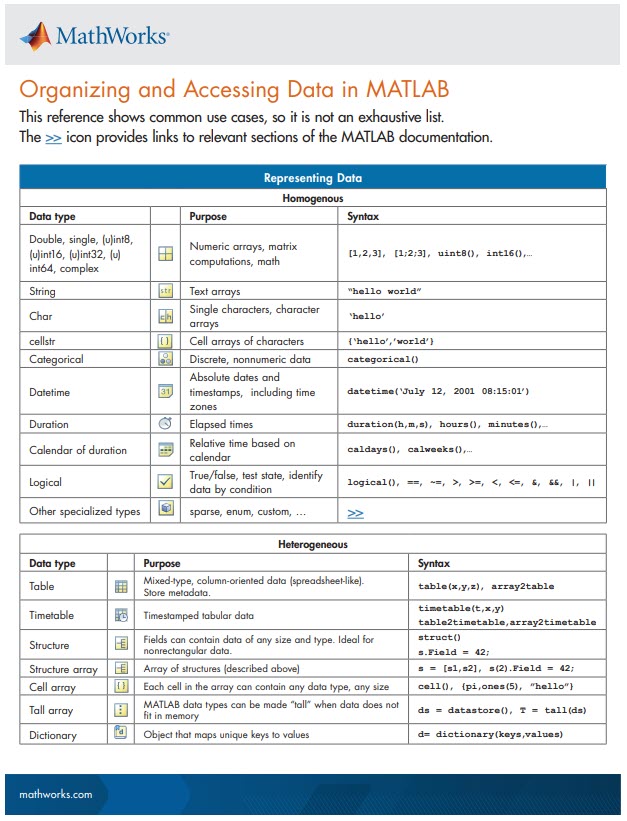
New Cheat Sheet Alert!
Level up your data organization and access skills in MATLAB with our latest cheat sheet! Download the full cheat sheet on MATLAB GitHub for Students here.
I rarely/never save .fig files
47%
Continue working on it later
16%
Archive for future reference
23%
Share within my organization
10%
Share outside my organization
2%
Other (please leave a comment)
2%
2097 votes
Adam and Heather will be discussing new features in R2023b and answering your questions in a few hours - visit the link below to check out the preview and sign up for notification.
Hello all,
I've been trying to shift my workflow more towards simbiology, it has a lot of very interesting features and it makes sense to try and do everything in one place if it works well..! Part of my hesitancy into this was some bad experiences handling units in the past, though this was almost certainly all out of my own ignorance, relatedly:
Getting onto my question.
In this model I have a species traveling around the body via blow flow, think a basic PBPK model. My species are picomolarities, if everything is already in concentrations, why is it necessary to initially divide by the compartment volume? i.e. 1/Pancreas below.

If my model dealt in molar quantities this would make a lot of sense, the division would represent the transition to concentrations. This, however, now necessitates my parameters be in units of liter/minute, which is actually correct, but I'd like clarification on why it's correct, ha!
Perhaps this is more of a modelling question than a simbiology question, but if there are answers I'd love to hear them. Thanks!
Adam Danz just launched a new blog about MATLAB Graphics and App Building.
As you know, He has been a prolific contributor to MATLAB Answers and one of his answers recently won the Editor's Choice Award.
If there are any topics or questions you are interested in, please share with Adam, and I am sure he will get those into his blog.
Calling all students! New to MATLAB or need helpful resources? Check out our MATLAB GitHub for Students repository! Find MATLAB examples, videos, cheat sheets, and more!

Visit the repository here: MATLAB GitHub for Students
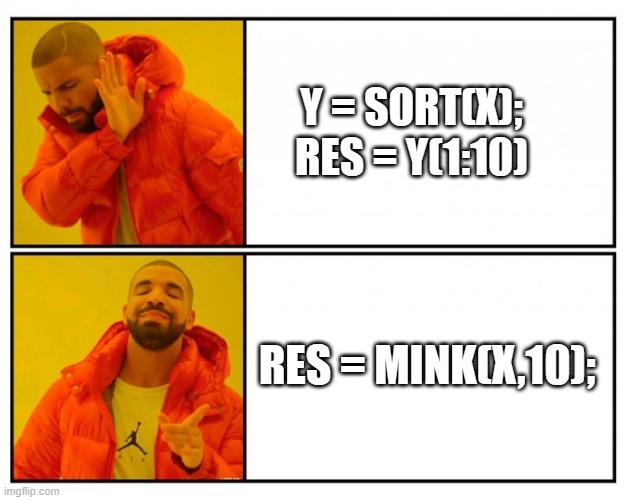
Imagine x is a large vector and you want the smallest 10 elements. How might you do it?
4 months ago, the new API was published to access content on the MATLAB Central community. I shared my MATLAB code to access the API at that time, but the team just released the official SDK.
MATLAB toolbox on File Exchange: https://www.mathworks.com/matlabcentral/fileexchange/135567-matlab-central-interface-for-matlab
Houman and Rameez will talk about how you can model wireless networks (5G, WLAN, Bluetooth, 802.11ax WLAN mesh, etc.) in MATLAB in the upcoming livestream. They will start with the basics such as nodes, links, topology and metrics. Then they will introduce a new free add-on library that lets you model such networks, and show you how to use it.
- Date: Thu, Oct 5, 2023
- Time: 11 am EDT (or your local time)
Bookmark this link:

Congratulations, @Adam Danz for winning the Editor's Pick badge awarded for MATLAB Answers, in recognition of your awesome solution in overlapping images in grid layout.
Thank you for going to great lengths to help a user in this thread by suggesting alternative approach to representing stack of playing cards in MATLAB, highlighting very interesting features like hggroup.
This badge recognizes awesome answers people contribute and yours was picked for providing a very detailed and helpful answer.
Thank you so much for setting a high standard for MATLAB Answers and for your ongoing contribution to the community.
MATLAB Central Team

You had a meteoric rise to in our community since you started answering questions in June 2020.
You provided 3218 answers and 926 votes. You are ranked #23 in the community. Thank you for your contribution to the community and please keep up the good track record!
MATLAB Central Team
Hi All,
I'm attempting to put a set of simbiology global sensitivity analysis plots into my thesis and I'm running into some issues with the GSA plots. Firstly, the figures are very large, it would be quite beneficial to grab a set of the plots and arrange them myself, is there any documentation on how to mess around with the '1x1 Sobol' produced by sbiosobol? Or just GSA plots in general.
The second problem is that the results appear to be relative to the most sensitive parameter in that run. Is it recommended to have a resonably sensitive 'baseline' parameter in each run? I find it difficult to compare plots when a not so sensitive parameter is being recorded as near '1' for the whole run because it's being stacked against a set of very insensitive parameters. I.e. if i have multiple sets of GSAs due to a large model, how can I easily compare results? If I could do some single run through with every parameter that would be the ideal, I imagine, but then the default plot would be half a mile off the bottom of my screen, haha! Perhaps there is a solution to the first question that might help there?
Thank you for your help,
Dan
MATLAB Onramp is a free online tutorial and it has been very popular with new MATLAB users to learn how to use it, and MathWorks have been adding more and more modules. The lastest one just dropped https://matlabacademy.mathworks.com/details/power-systems-simulation-onramp/orps
It shows you the basics of power system simulation by modeling a simple microgrid. You will learn how to simulate and measure three-phase circuits, and how to evaluate algorithms like droop control and maximum power point tracking.
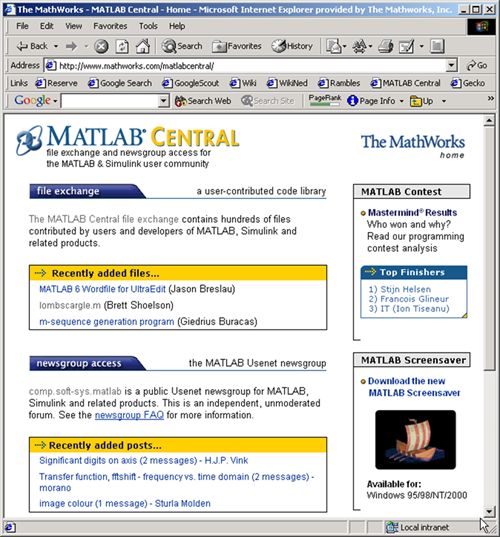
Here's a screenshot from 22 years ago. Thanks for building one of the best engineering and science communities together.
cities
15%
beaches, islands, or cruises
22%
rivers, lakes, or mountains
33%
National Parks or historical sites
14%
wherever my family lives
12%
somewhere else
5%
13709 votes