Results for
Spring is here in Natick and the tulips are blooming! While tulips appear only briefly here in Massachusetts, they provide a lot of bright and diverse colors and shapes. To celebrate this cheerful flower, here's some code to create your own tulip!

Drumlin Farm has welcomed MATLAMB, named in honor of MathWorks, among ten adorable new lambs this season!

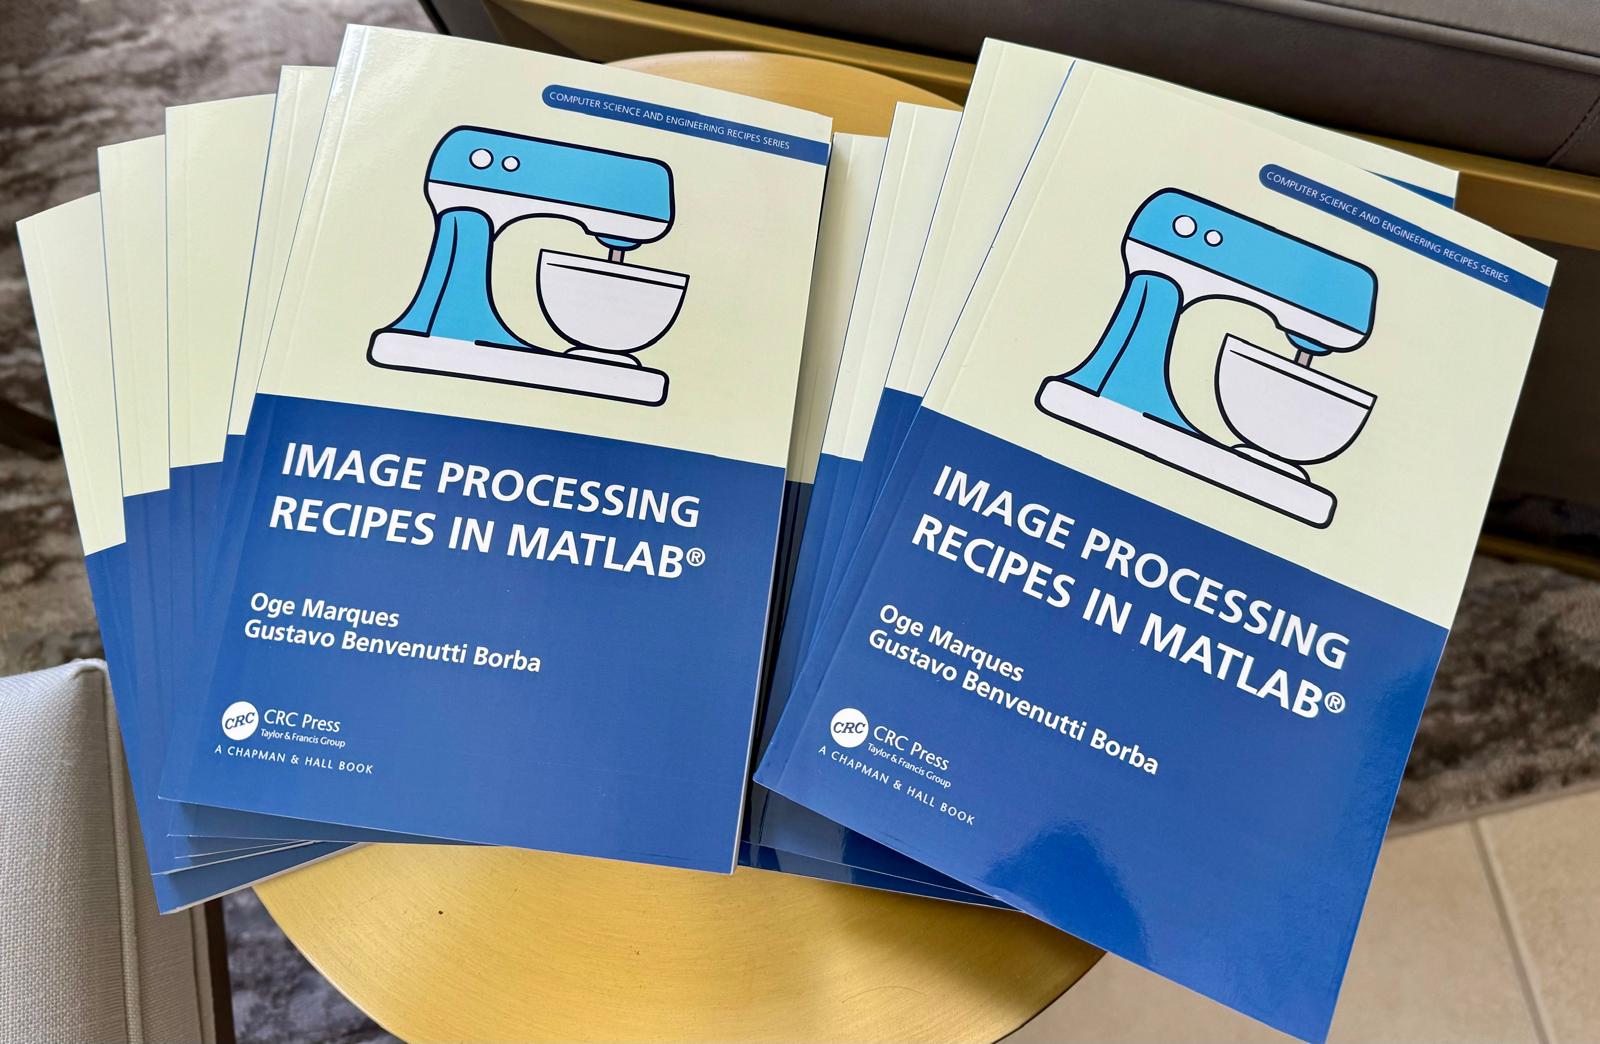
📚 New Book Announcement: "Image Processing Recipes in MATLAB" 📚
I am delighted to share the release of my latest book, "Image Processing Recipes in MATLAB," co-authored by my dear friend and colleague Gustavo Benvenutti Borba.
This 'cookbook' contains 30 practical recipes for image processing, ranging from foundational techniques to recently published algorithms. It serves as a concise and readable reference for quickly and efficiently deploying image processing pipelines in MATLAB.
Gustavo and I are immensely grateful to the MathWorks Book Program for their support. We also want to thank Randi Slack and her fantastic team at CRC Press for their patience, expertise, and professionalism throughout the process.
___________
I found this plot of words said by different characters on the US version of The Office sitcom. There's a sparkline for each character from pilot to finale episode.
What's your way?

Mari is helping Dad work.

Today, he got dressed for work to design some new dog toy-making algorithms. #nationalpetday

Transforming my furry friend into a grayscale masterpiece with MATLAB! 🐾 #MATLABPetsDay ✌️


This is Stella while waiting to see if the code works...

Join us for a hands-on workshop focussing on Global Sensitivity Analysis (GSA) for QSP using SimBiology. This complimentary session aims to give you theoretical background and hands-on experience with GSA methods.
🗓️ Event Details: June 25, 1-5pm CEST @PAGE 2024, Rome
🔖 Registration: Free, but space is limited. Early registration is recommended to ensure your place in this workshop.
For more details and to register, please visit https://www.mathworks.com/company/events/seminars/global-sensitivity-analysis-with-simbiology-4361208.html
Hi All,
I'm trying to produce some nice figures from the graphical user interface and have a set of local sensitivity analyses that I'd like to combine.
I have two inputs that vary the sensitivies of my system and would like to plot them on top of each other like:
Is there either a way to do this natively in simbiology (when you try and use 'keep results from each run' it plots them both as a time series) or to export the sensitivity data to the normal matlab programatic UI where I can combine them by hand?
Thank you for your help!
In one line of MATLAB code, compute how far you can see at the seashore. In otherwords, how far away is the horizon from your eyes? You can assume you know your height and the diameter or radius of the earth.
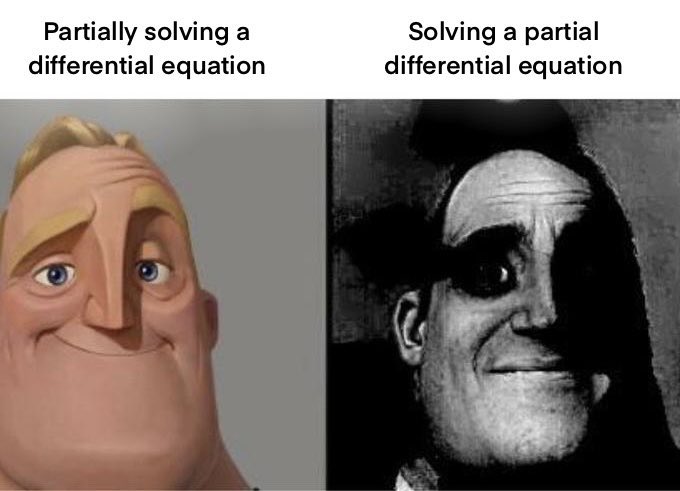
Keep calm and study PDEs
Me at the beginning of every meeting

A bit late. Compliments to Chris for sharing.
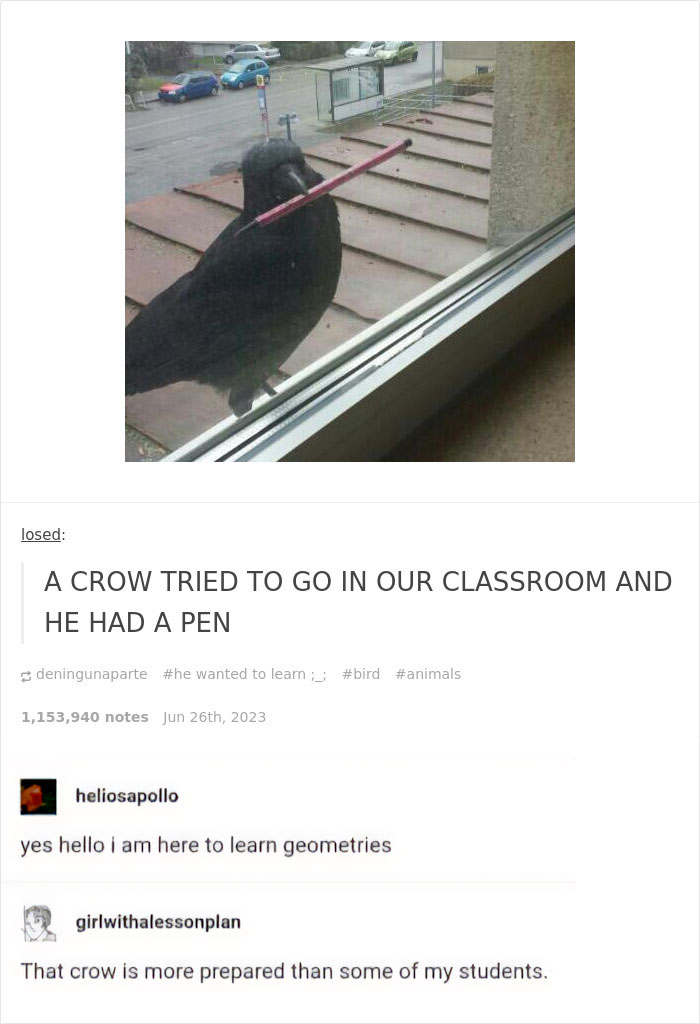
can you relate?
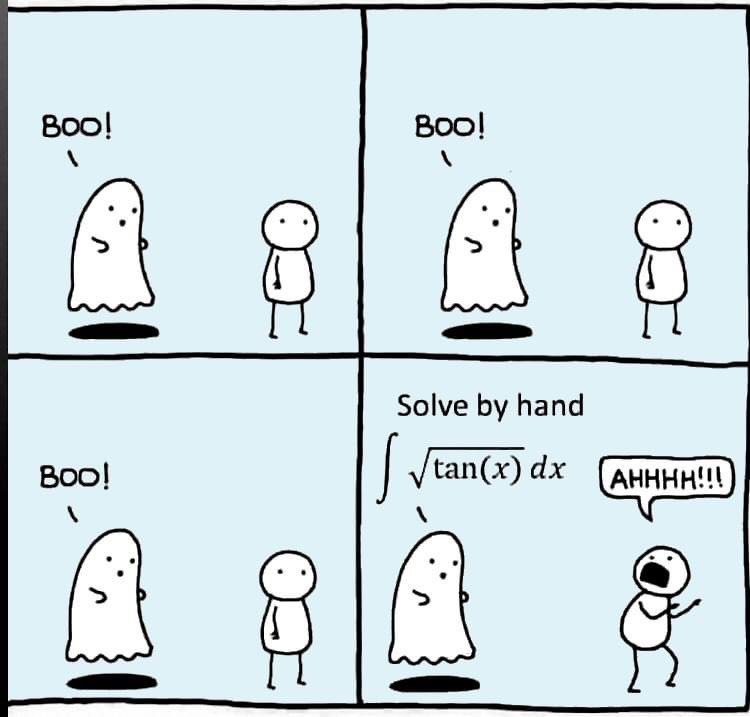
Can you solve it?
Happy year of the dragon.

Can you see them?
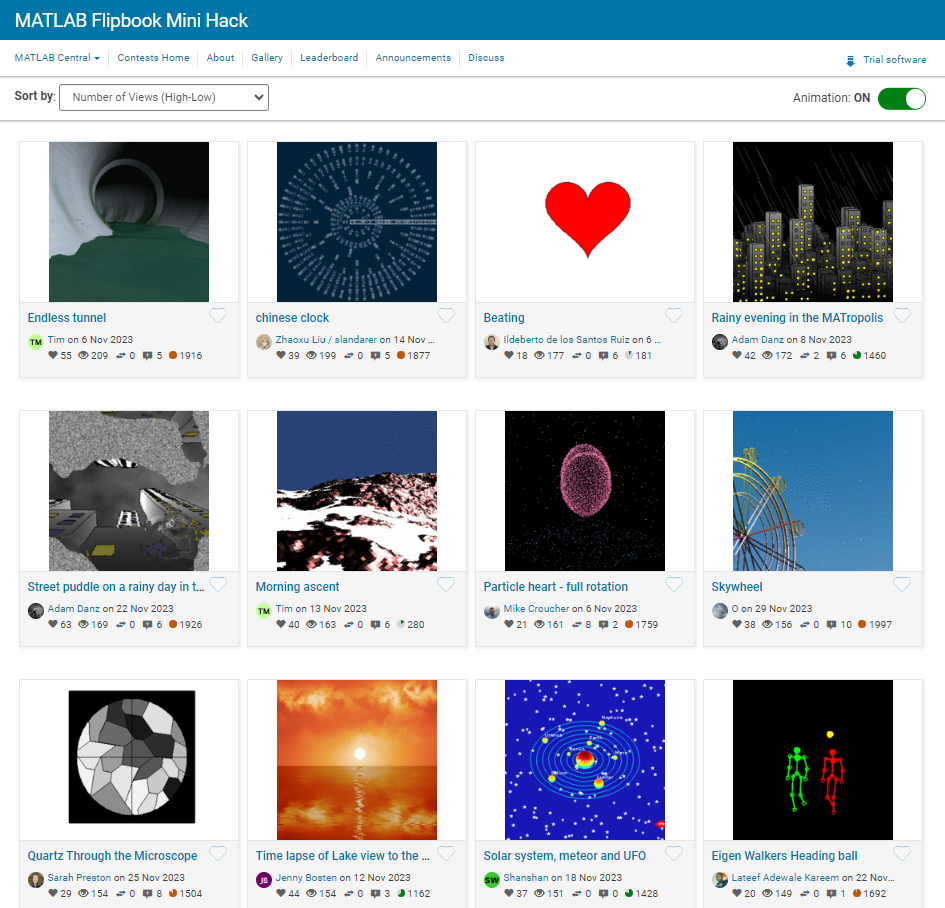
I have been procrastinating on schoolwork by looking at all the amazing designs created in the last MATLAB Flipbook Mini Hack! They are just amazing. The voting is over but what are y'all's personal favorites? Mine is the flapping butterfly, it is for sure a creation I plan to share with others in the future!