Results for
Christmas season is underway at my house:
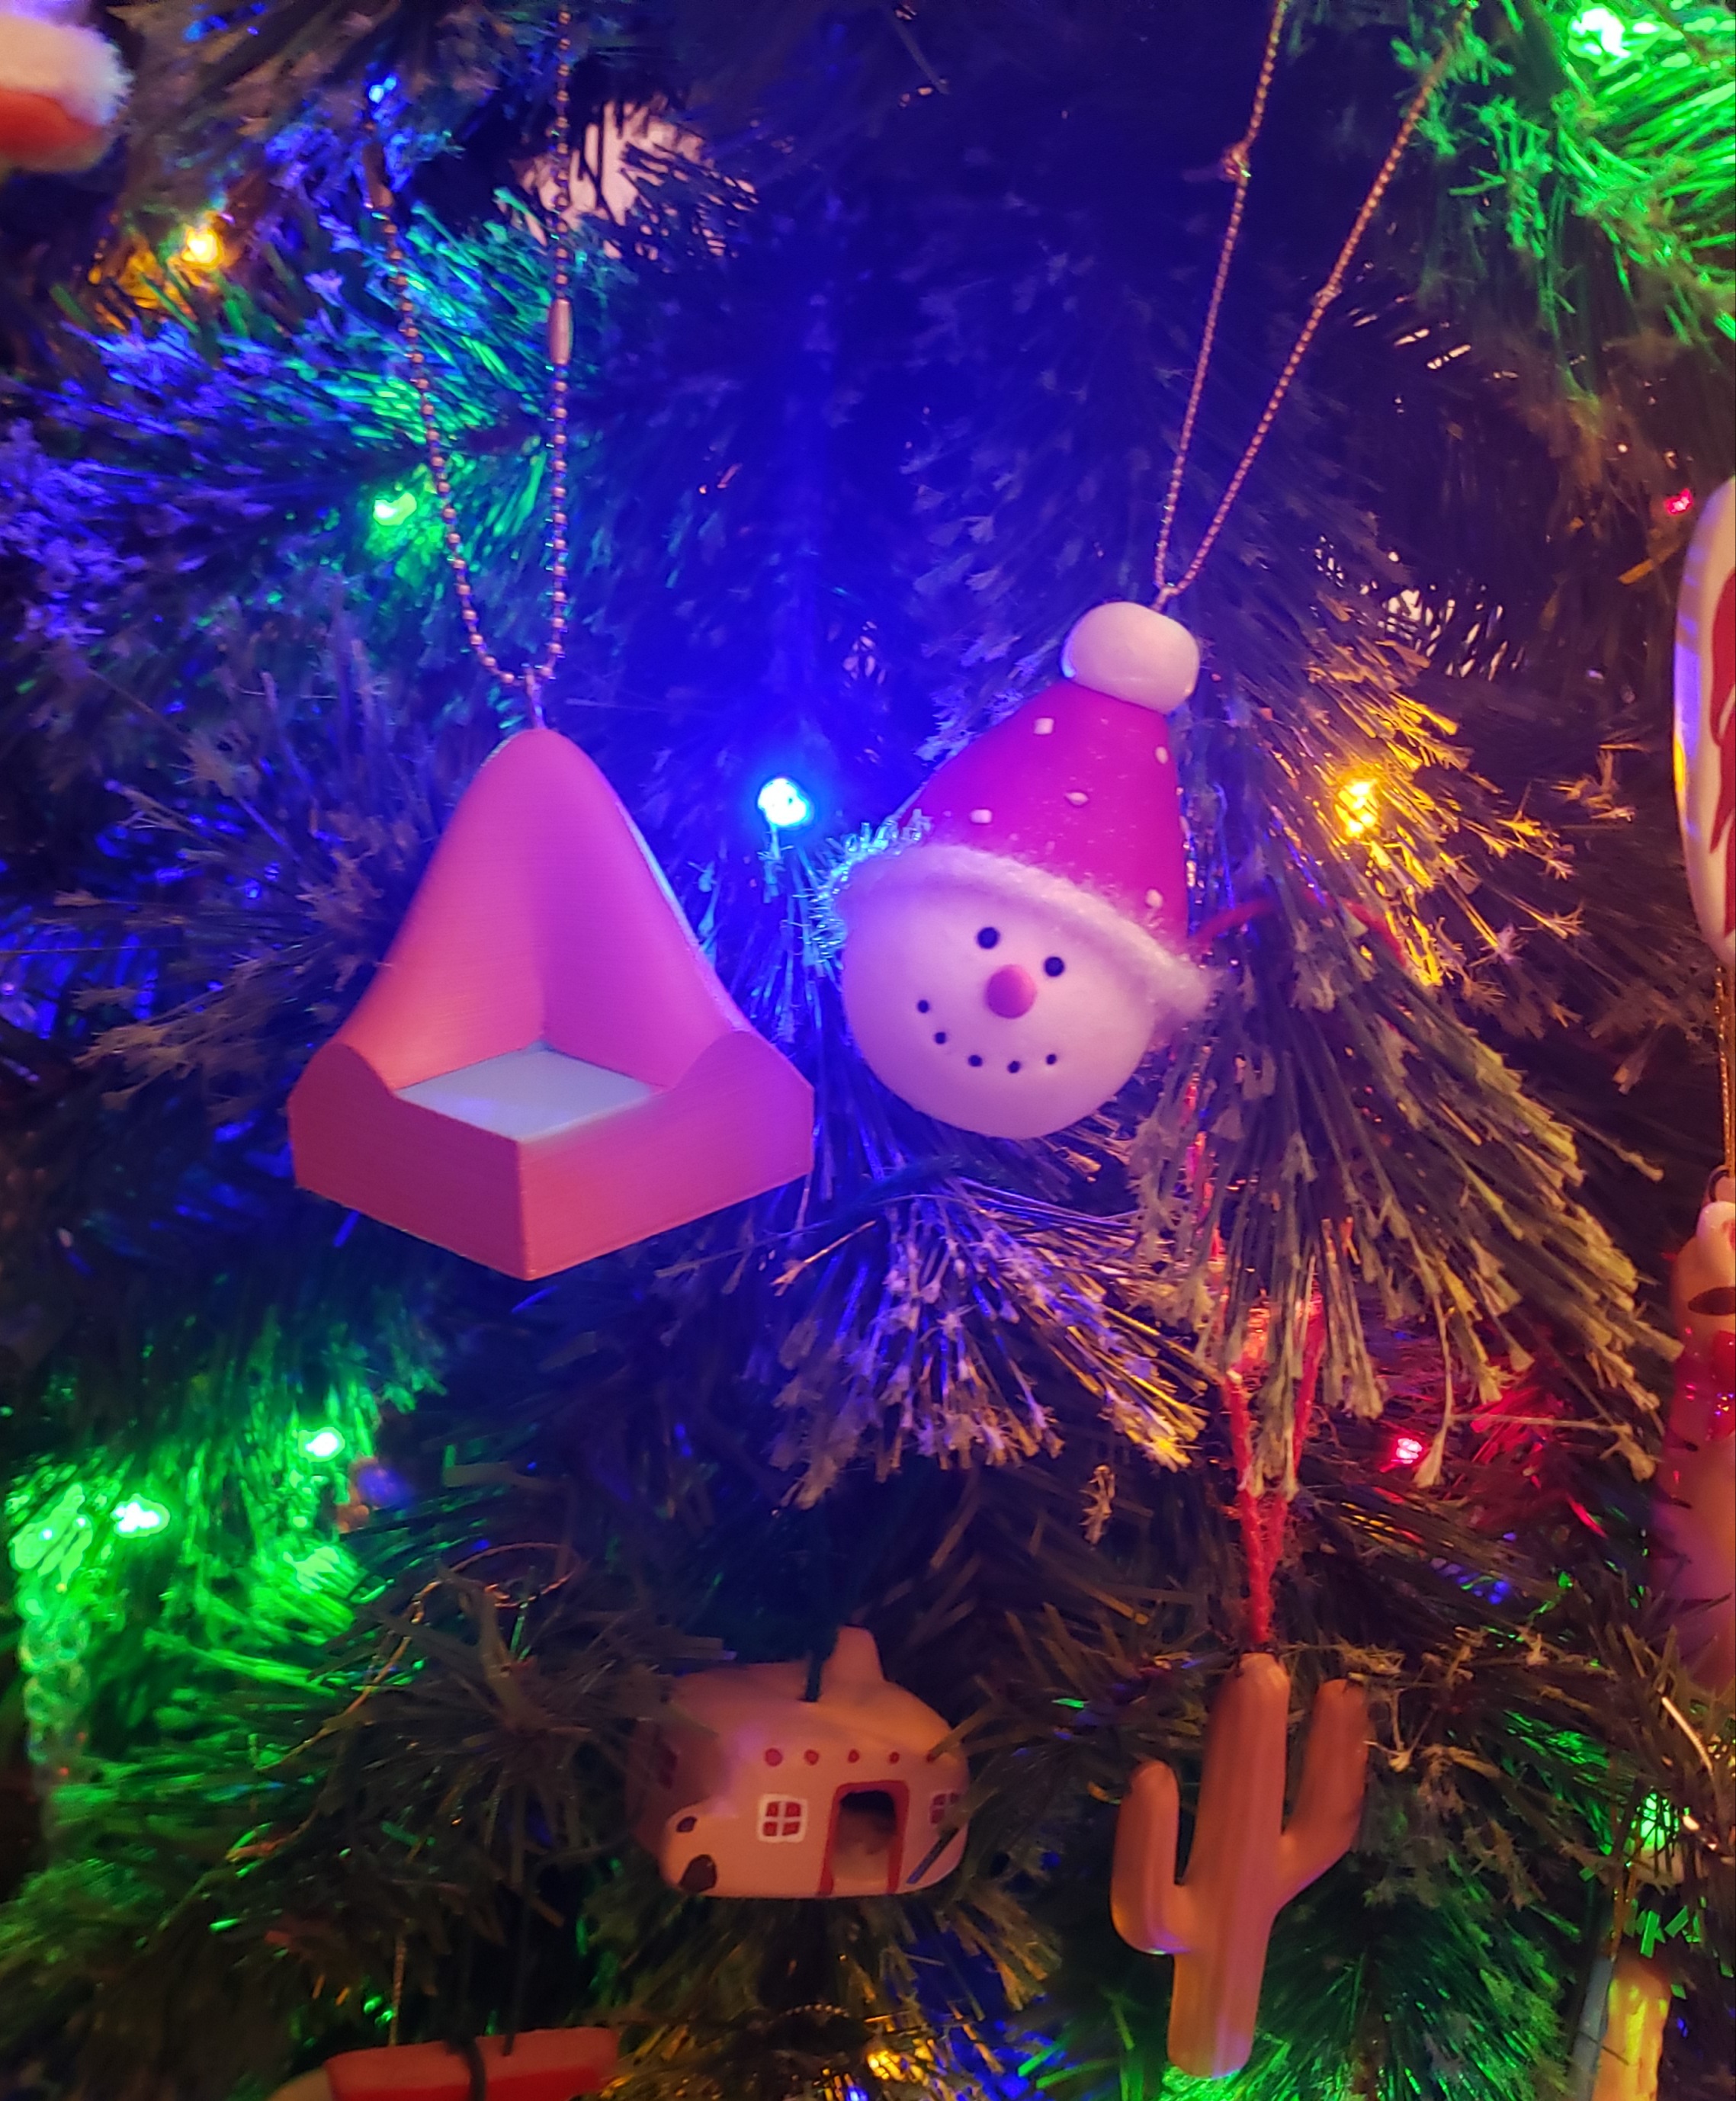
(Sorry - the ornament is not available at the MathWorks Merch Shop -- I made it with a 3-D printer.)
So I made this.
clear
close all
clc
% inspired from: https://www.youtube.com/watch?v=3CuUmy7jX6k
%% user parameters
h = 768;
w = 1024;
N_snowflakes = 50;
%% set figure window
figure(NumberTitle="off", ...
name='Mat-snowfalling-lab (right click to stop)', ...
MenuBar="none")
ax = gca;
ax.XAxisLocation = 'origin';
ax.YAxisLocation = 'origin';
axis equal
axis([0, w, 0, h])
ax.Color = 'k';
ax.XAxis.Visible = 'off';
ax.YAxis.Visible = 'off';
ax.Position = [0, 0, 1, 1];
%% first snowflake
ht = gobjects(1, 1);
for i=1:length(ht)
ht(i) = hgtransform();
ht(i).UserData = snowflake_factory(h, w);
ht(i).Matrix(2, 4) = ht(i).UserData.y;
ht(i).Matrix(1, 4) = ht(i).UserData.x;
im = imagesc(ht(i), ht(i).UserData.img);
im.AlphaData = ht(i).UserData.alpha;
colormap gray
end
%% falling snowflake
tic;
while true
% add a snowflake every 0.3 seconds
if toc > 0.3
if length(ht) < N_snowflakes
ht = [ht; hgtransform()];
ht(end).UserData = snowflake_factory(h, w);
ht(end).Matrix(2, 4) = ht(end).UserData.y;
ht(end).Matrix(1, 4) = ht(end).UserData.x;
im = imagesc(ht(end), ht(end).UserData.img);
im.AlphaData = ht(end).UserData.alpha;
colormap gray
end
tic;
end
ax.CLim = [0, 0.0005]; % prevent from auto clim
% move snowflakes
for i = 1:length(ht)
ht(i).Matrix(2, 4) = ht(i).Matrix(2, 4) + ht(i).UserData.velocity;
end
if strcmp(get(gcf, 'SelectionType'), 'alt')
set(gcf, 'SelectionType', 'normal')
break
end
drawnow
% delete the snowflakes outside the window
for i = length(ht):-1:1
if ht(i).Matrix(2, 4) < -length(ht(i).Children.CData)
delete(ht(i))
ht(i) = [];
end
end
end
%% snowflake factory
function snowflake = snowflake_factory(h, w)
radius = round(rand*h/3 + 10);
sigma = radius/6;
snowflake.velocity = -rand*0.5 - 0.1;
snowflake.x = rand*w;
snowflake.y = h - radius/3;
snowflake.img = fspecial('gaussian', [radius, radius], sigma);
snowflake.alpha = snowflake.img/max(max(snowflake.img));
end
I am using the ELECFREAKS IOT:bit Expansion Board with micro:bit to record data, it worked normally but in this week I tested again, and discover no data is uploaded to the channel ie.no entries in channel. The code in makecode are the same as before and the wifi is work, I cannot find the reason that cause this failure.
I am using the free option with 4 channels available. I do not have any channels listed, but when I want to create a new channel it gives me an error massage to say that I have used up my 4 channels and need to purchase units to create additional channels.
Is it possible to differenciate the input, output and in-between wires by colors?
At the present time, the following problems are known in MATLAB Answers itself:
- Symbolic output is not displaying. The work-around is to disp(char(EXPRESSION)) or pretty(EXPRESSION)
- Symbolic preferences are sometimes set to non-defaults
Hello, MATLAB fans!
For years, many of you have expressed interest in getting your hands on some cool MathWorks merchandise. I'm thrilled to announce that the wait is over—the MathWorks Merch Shop is officially open!
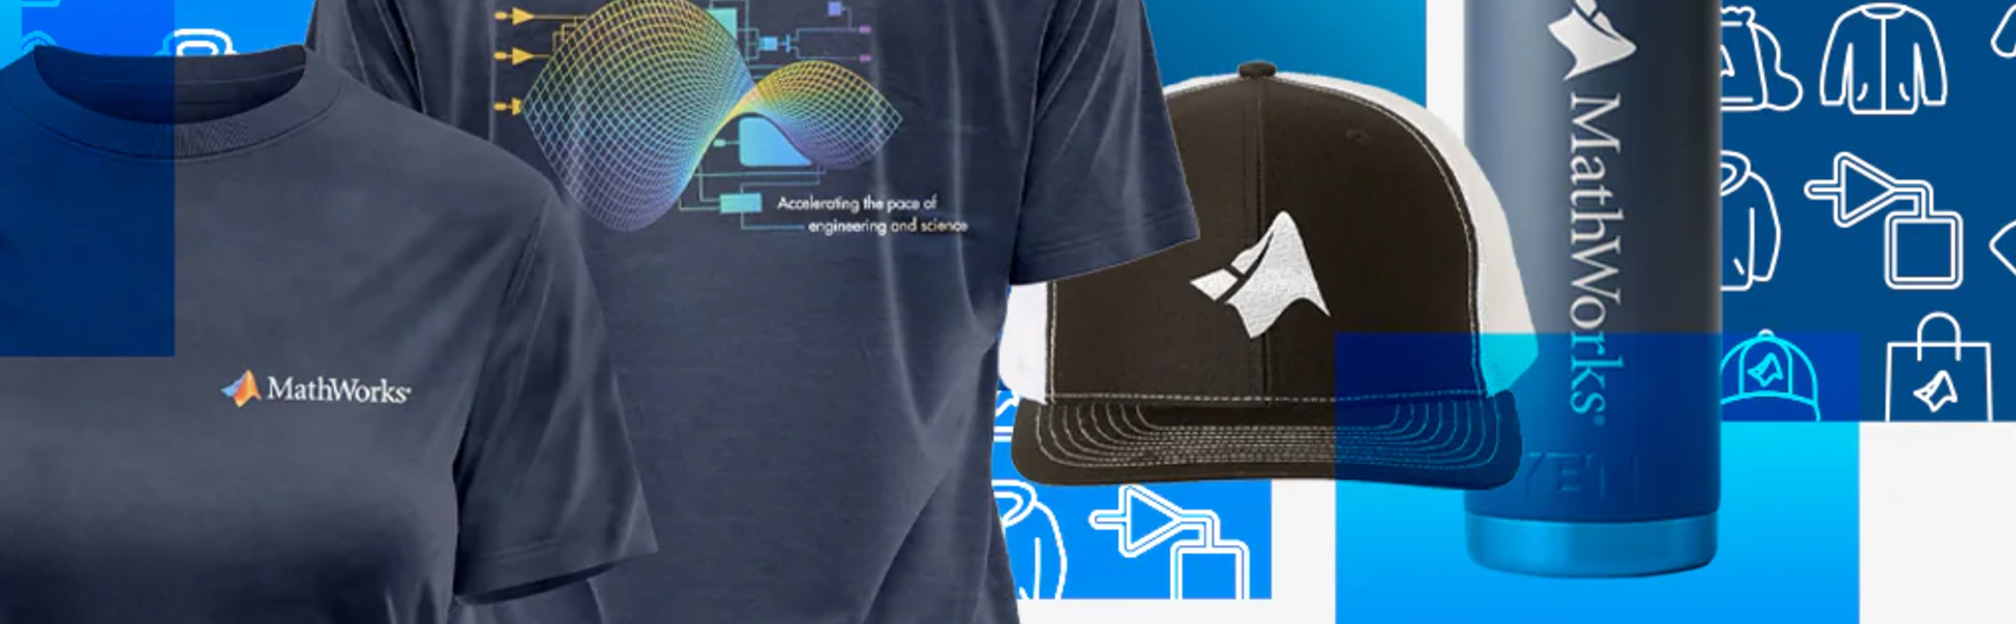
In our shop, you'll find a variety of exciting items, including baseball caps, mugs, T-shirts, and YETI bottles.
Visit the shop today and explore all the fantastic merchandise we have to offer. Happy shopping!
I was curious to startup your new AI Chat playground.
The first screen that popped up made the statement:
"Please keep in mind that AI sometimes writes code and text that seems accurate, but isnt"
Can someone elaborate on what exactly this means with respect to your AI Chat playground integration with the Matlab tools?
Are there any accuracy metrics for this integration?
Just shared an amazing YouTube video that demonstrates a real-time PID position control system using MATLAB and Arduino.
Hello
I have 3 devices (IOT board using SIM7600 module) sending one value to Thingsspeak. Have been working just fine a couple of years. However 14/11-24 I receive http error code 406 for all 3 devices.
The http get is working just fine when testing directly in the browser (https://api.thingspeak.com/update?api_key=xxxxx&field1=33), the server return the entrie number.
However, when running the same address via SIM7600 I receive - +HTTPACTION: 0,406,0
Any tips for the 406 error code?
I don't like the change
16%
I really don't like the change
29%
I'm okay with the change
24%
I love the change
11%
I'm indifferent
11%
I want both the web & help browser
11%
38 votes
Hello, I am wondering why I have over 12000 messages (writes)per day to a channel which I only update all 8 fields every 20 minutes. Or are these statistic timely delayed? Since testing I might have more writes, but now with my ready weather station only every 20 minutes my data will be updated. Wetterbox Channel ID: 2391212 Access: Public Can you explain this to me? Thank you for your help. Regards, Julian

You can make a lot of interesting objects with matlab primitive shapes (e.g. "cylinder," "sphere," "ellipsoid") by beginning with some of the built-in Matlab primitives and simply applying deformations. The gif above demonstrates how the Manta animation was created using a cylinder as the primitive and successively applying deformations: (https://www.mathworks.com/matlabcentral/communitycontests/contests/8/entries/16252);
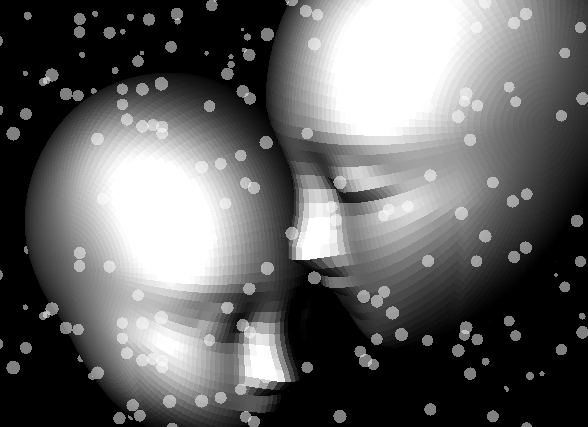
Similarly, last year a sphere was deformed to create a face in two of my submissions, for example, the profile in "waking":
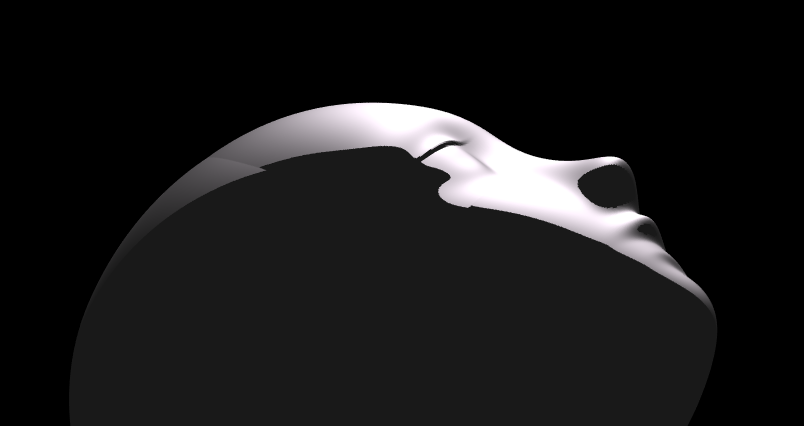
You can piece-wise assemble images, but one of the advantages of creating objects with deformations is that you have a parametric representation of the surface. Creating a higher or lower polygon rendering of the surface is as simple as declaring the number of faces in the orignal primitive. For example here is the scene in "snowfall" using sphere with different numbers of input faces:
sphere(100)
sphere(500)
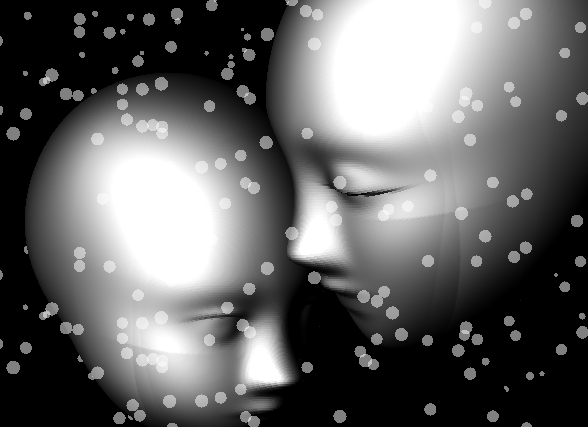
High poly models aren't always better. Low-polygon shapes can sometimes add a little distance from that low point in the uncanny valley.
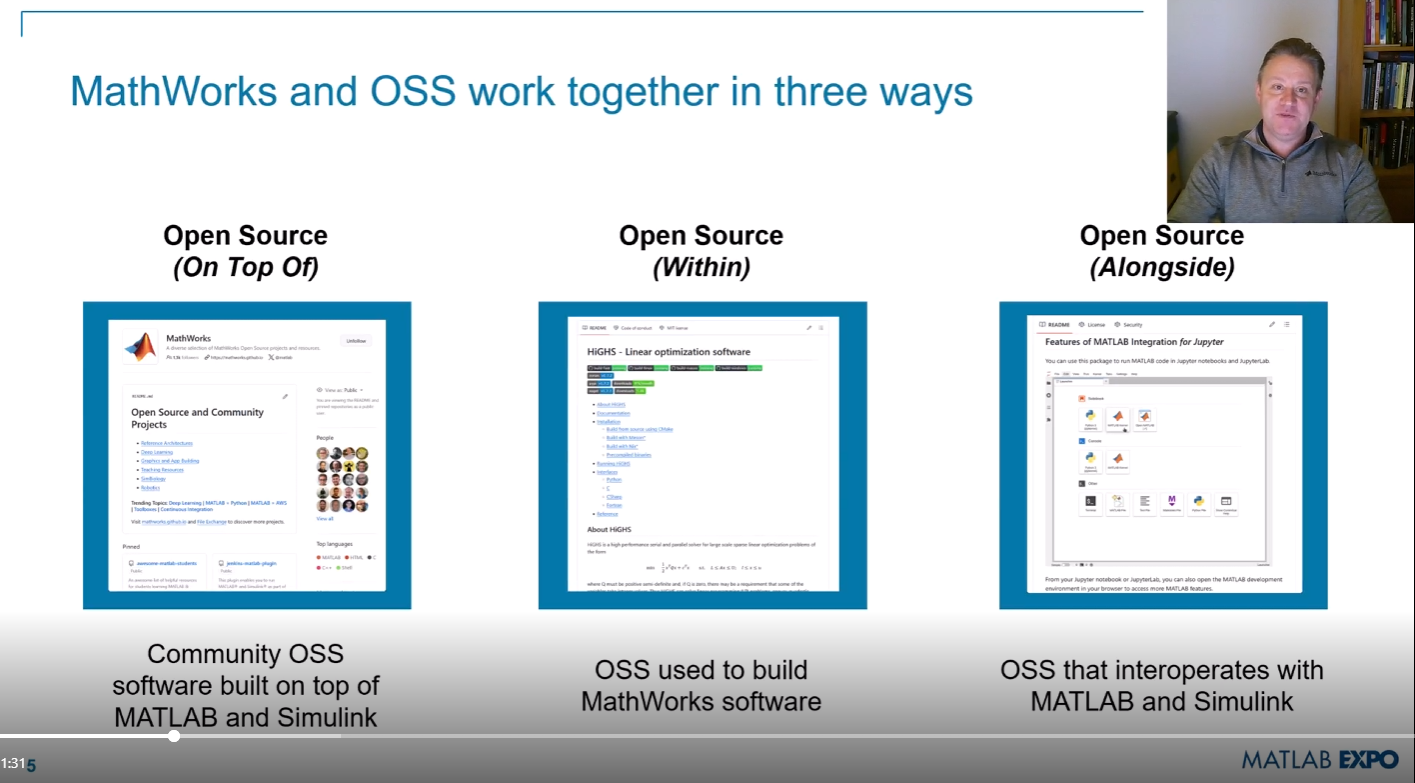
Next week is MATLAB EXPO week and it will be the first one that I'm presenting at! I'll be giving two presentations, both of which are related to the intersection of MATLAB and open source software.
- Open Source Software and MATLAB: Principles, Practices, and Python Along with MathWorks' Heather Gorr. We we discuss three different types of open source software with repsect to their relationship to MATLAB
- The CLASSIX Story: Developing the Same Algorithm in MATLAB and Python Simultaneously A collaboration with Prof. Stefan Guettel from University of Manchester. Developing his clustering algorithm, CLASSIX, in both Python and MATLAB simulatenously helped provide insights that made the final code better than if just one language was used.
There are a ton of other great talks too. Come join us! (It's free!) MATLAB EXPO 2024
It would be nice to have a function to shade between two curves. This is a common question asked on Answers and there are some File Exchange entries on it but it's such a common thing to want to do I think there should be a built in function for it. I'm thinking of something like
plotsWithShading(x1, y1, 'r-', x2, y2, 'b-', 'ShadingColor', [.7, .5, .3], 'Opacity', 0.5);
So we can specify the coordinates of the two curves, and the shading color to be used, and its opacity, and it would shade the region between the two curves where the x ranges overlap. Other options should also be accepted, like line with, line style, markers or not, etc. Perhaps all those options could be put into a structure as fields, like
plotsWithShading(x1, y1, options1, x2, y2, options2, 'ShadingColor', [.7, .5, .3], 'Opacity', 0.5);
the shading options could also (optionally) be a structure. I know it can be done with a series of other functions like patch or fill, but it's kind of tricky and not obvious as we can see from the number of questions about how to do it.
Does anyone else think this would be a convenient function to add?
My favorite image processing book is The Image Processing Handbook by John Russ. It shows a wide variety of examples of algorithms from a wide variety of image sources and techniques. It's light on math so it's easy to read. You can find both hardcover and eBooks on Amazon.com Image Processing Handbook
There is also a Book by Steve Eddins, former leader of the image processing team at Mathworks. Has MATLAB code with it. Digital Image Processing Using MATLAB
You might also want to look at the free online book http://szeliski.org/Book/
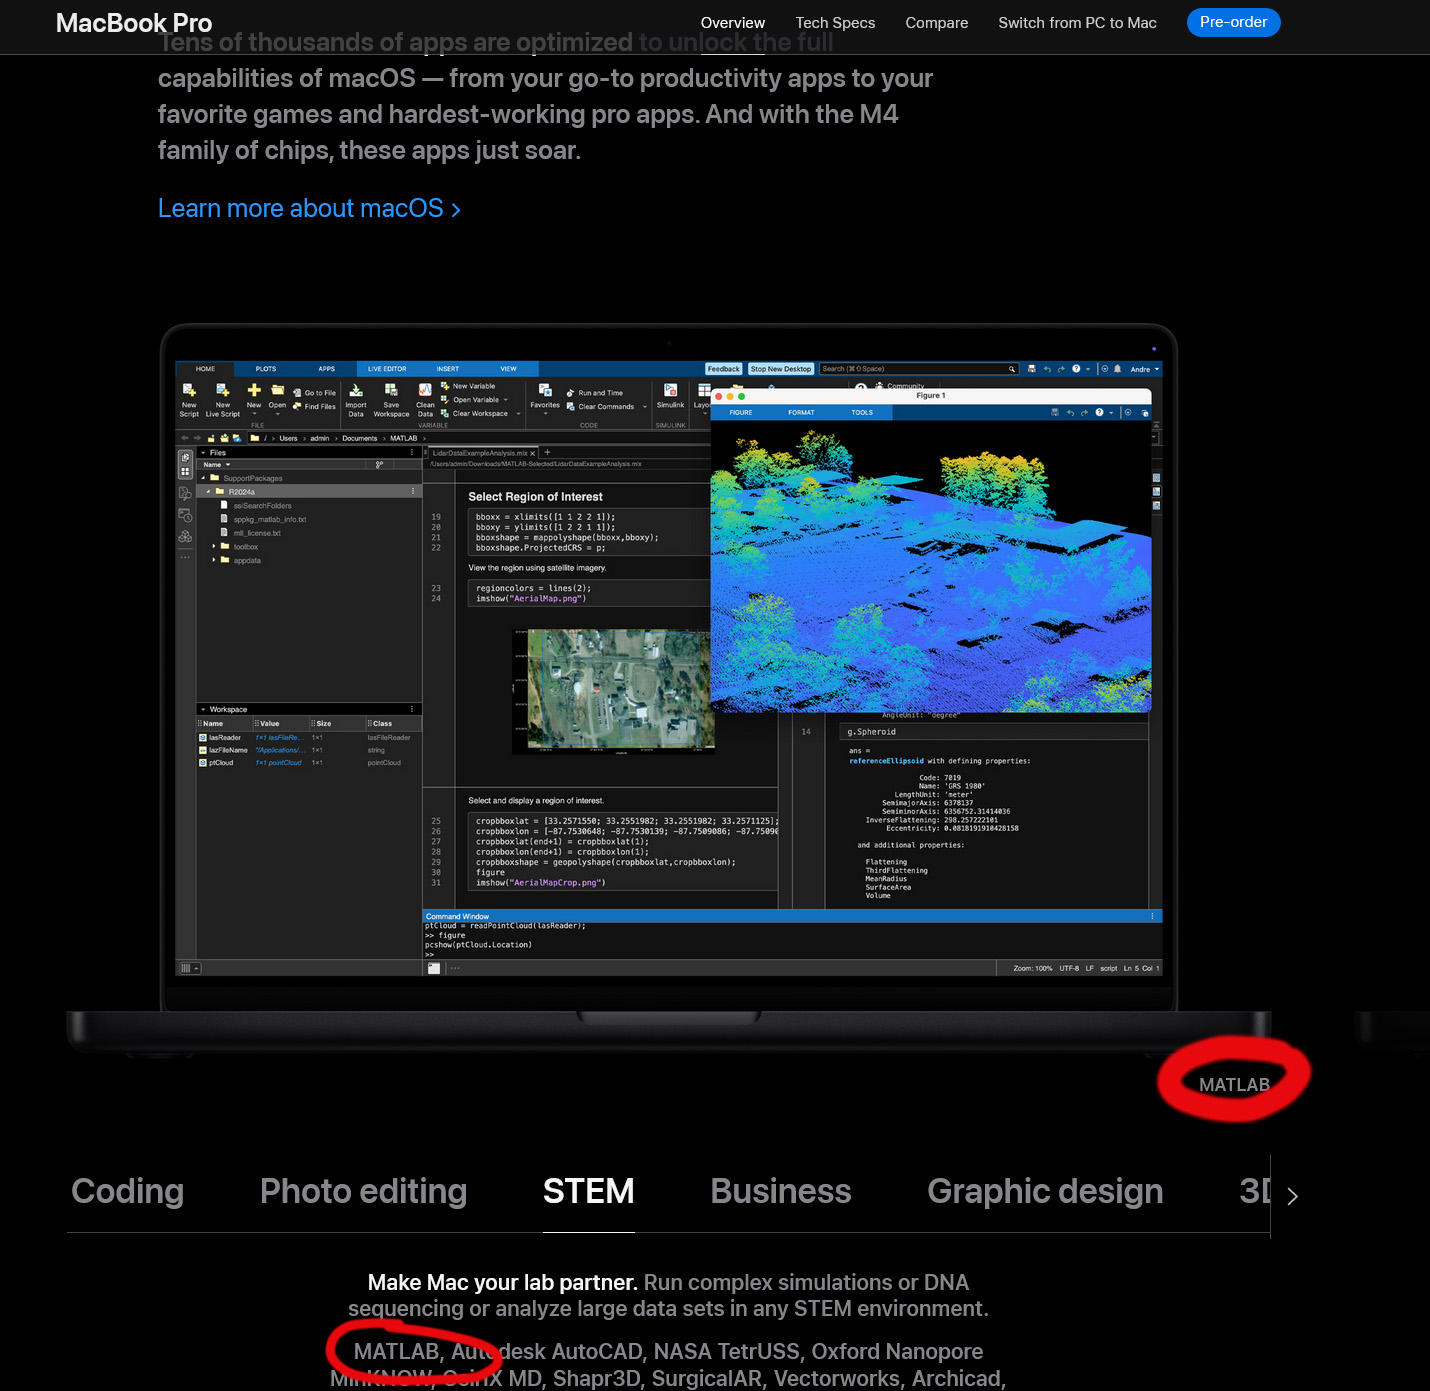
Go to this page, scroll down to the middle of the long page where you see "Coding Photo editing STEM Business ...." and select "STEM". Voilà!
In the past two years, large language models have brought us significant changes, leading to the emergence of programming tools such as GitHub Copilot, Tabnine, Kite, CodeGPT, Replit, Cursor, and many others. Most of these tools support code writing by providing auto-completion, prompts, and suggestions, and they can be easily integrated with various IDEs.
As far as I know, aside from the MATLAB-VSCode/MatGPT plugin, MATLAB lacks such AI assistant plugins for its native MATLAB-Desktop, although it can leverage other third-party plugins for intelligent programming assistance. There is hope for a native tool of this kind to be built-in.
Mini Hack is brilliant!Let's use MATLAB to create the future!