show
Description
show( displays the 3D histogram of the
desired direction calculated by the 3DVFH+ algorithm. The figure also includes the UAV
position, UAV orientation, obstacle positions, and target position specified to the vfh3D)controllerVFH3D
object vfh3D at the most recent object call.
show(
specifies options using one or more name-value arguments. For example,
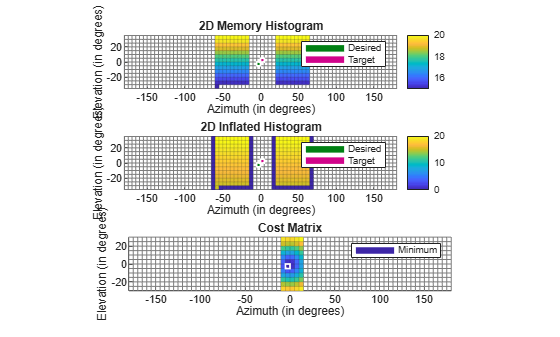
vfh3D,Name=Value)show(vfh3D,PlotsToShow="Cost Matrix") displays only the cost matrix
plot instead of the default histogram.
ax = show(___)
Examples
Create a controllerVFH3D object.
vfh3D = controllerVFH3D;
Create obstacles.
az = [-60:-20 20:60]*(pi/180);
el = (-30:30)*(pi/180);
[El,Az] = meshgrid(el,az);
Specify the distances of the obstacles from the sensor, and convert to Cartesian coordinates.
obstacleDist = linspace(15,20,numel(El(:)));
[xSensor,ySensor,zSensor] = sph2cart(Az(:),El(:),obstacleDist');
Align the sensor and histogram frames.
vfh3D.SensorOrientation = [-180 0 0];
Specify the sensor range limits.
vfh3D.DistanceLimits = [0.2 25];
Specify the current UAV position and orientation, the locations of obstacles, and the target position for the UAV.
uavPosition = [0; 0; 0];
uavOrientation = [1; 0; 0; 0];
sensorPoints = [xSensor ySensor zSensor];
targetPosition = [20; 0; 0];
Compute an obstacle-free direction and desired yaw for the UAV, and return the status of the obstacle-free direction.
[desiredDirection,desiredYaw,status] = vfh3D(uavPosition, ...
                                             uavOrientation, ...
                                             sensorPoints, ...
                                             targetPosition);
Visualize the default histogram of the calculated direction.
show(vfh3D)
axis equal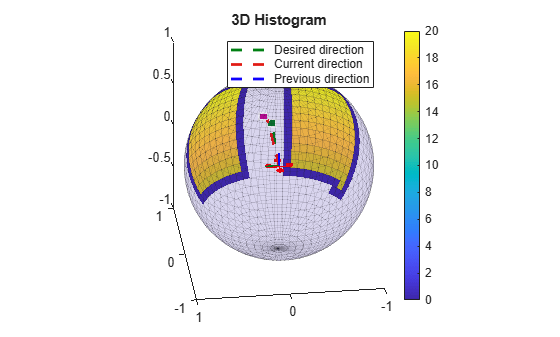
Visualize the 2D memory histogram, 2D inflated histogram, and cost matrix.
figure
ax(1) = subplot(3,1,1);
ax(2) = subplot(3,1,2);
ax(3) = subplot(3,1,3);
show(vfh3D, ...
     Parent=ax, ...
     PlotsToShow=["2D Memory Histogram","2D Inflated Histogram","Cost Matrix"])
axis(ax,"equal")
xlim(ax,"tight")
Input Arguments
Name-Value Arguments
Output Arguments
Version History
Introduced in R2022b