average
Compute performance metrics for average receiver operating characteristic (ROC) curve in multiclass problem
Since R2022a
Syntax
Description
[
computes the averages of performance metrics stored in the FPR,TPR,Thresholds,AUC] = average(rocObj,type)rocmetrics object
rocObj for a multiclass classification problem using the averaging
method specified in type. The function returns the average false
positive rate (FPR) and the average true positive rate
(TPR) for each threshold value in Thresholds.
The function also returns AUC, the area under the ROC curve composed of
FPR and TPR.
[
computes the performance metrics and returns avg1,avg2,Thresholds,AUC] = average(rocObj,type,metric1,metric2)avg1 (the average of
metric1) and avg2 (the average of
metric2) in addition to Thresholds, the
corresponding threshold for each of the average values, and AUC, the AUC
of the curve generated by metric1 and metric2. (since R2024a)
average supports the AUC output only when
metric1 and metric2 are TPR and FPR, or instead
are precision and recall:
TPR and FPR — Specify TPR using
"TruePositiveRate","tpr", or"recall", and specify FPR using"FalsePositiveRate"or"fpr". These choices specify that AUC is a ROC curve.Precision and recall — Specify precision using
"PositivePredictiveValue","ppv","prec", or"precision", and specify recall using"TruePositiveRate","tpr", or"recall". These choices specify that AUC is the area under a precision-recall curve.
Examples
Compute the performance metrics for a multiclass classification problem by creating a rocmetrics object, and then compute the average values for the metrics by using the average function. Plot the average ROC curve using the outputs of average.
Load the fisheriris data set. The matrix meas contains flower measurements for 150 different flowers. The vector species lists the species for each flower. species contains three distinct flower names.
load fisheririsTrain a classification tree that classifies observations into one of the three labels. Cross-validate the model using 10-fold cross-validation.
rng("default") % For reproducibility
Mdl = fitctree(meas,species,Crossval="on");
Compute the classification scores for validation-fold observations.
[~,Scores] = kfoldPredict(Mdl);
size(Scores)
ans = 1×2

   150     3
The output Scores is a matrix of size 150-by-3. The column order of Scores follows the class order in Mdl, stored in Mdl.ClassNames.
Create a rocmetrics object by using the true labels in species and the classification scores in Scores. Specify the column order of Scores using Mdl.ClassNames.
rocObj = rocmetrics(species,Scores,Mdl.ClassNames);
rocmetrics computes the FPR and TPR at different thresholds and finds the AUC value for each class.
Compute the average performance metric values, including the FPR and TPR at different thresholds using the macro-averaging method.
[FPR,TPR,Thresholds,AUC] = average(rocObj,"macro");Plot the average ROC curve and display the average AUC value..
plot(rocObj,AverageCurveType="macro",ClassNames=[])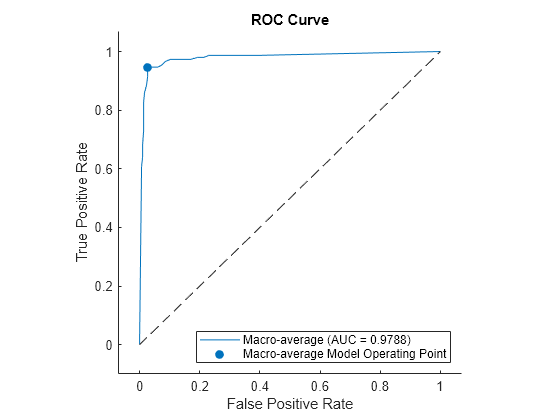
To display all the ROC curves and AUC values, do not set the ClassNames argument to [].
plot(rocObj,AverageCurveType="macro")
Load the fisheriris data set. The matrix meas contains flower measurements for 150 different flowers. The vector species lists the species for each flower. species contains three distinct flower names.
Train a classification tree that classifies observations into one of the three labels.
load fisheriris
mdl = fitctree(meas,species);
Create a rocmetrics object from the classification tree model.
roc = rocmetrics(mdl,meas,species); % Input data meas and response species requiredObtain the average macro recall and precision statistics in addition to the threshold and AUC statistics.
[avgRecall,avgPrec,thresh,AUC] = average(roc,"macro","recall","precision")
avgRecall = 9×1

         0
    0.6533
    0.9533
    0.9800
    0.9933
    0.9933
    1.0000
    1.0000
    1.0000
avgPrec = 9×1

       NaN
    1.0000
    0.9929
    0.9811
    0.9560
    0.9203
    0.7804
    0.6462
    0.3333
thresh = 9×1

    1.0000
    1.0000
    0.9565
    0.3333
   -0.3333
   -0.6667
   -0.9565
   -0.9783
   -1.0000
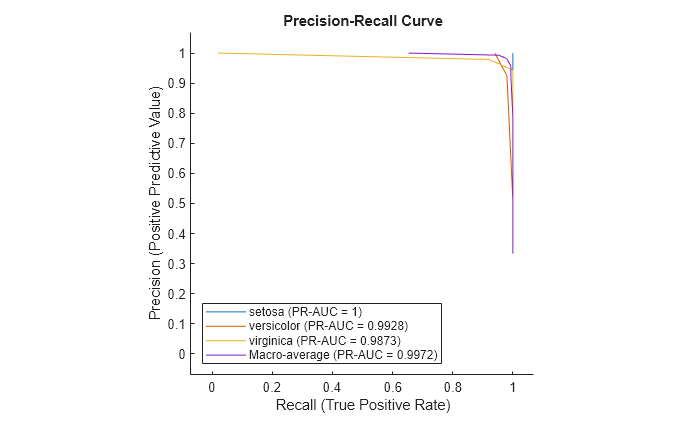
AUC =
0.9972
Plot the ROC curve for the recall and precision metrics.
plot(roc,AverageCurveType="macro",XAxisMetric="recall",YAxisMetric="precision")
Input Arguments
Output Arguments
More About
Algorithms
Alternative Functionality
You can use the
plotfunction to create the average ROC curve. The function returns aROCCurveobject containing theXData,YData,Thresholds, andAUCproperties, which correspond to the output argumentsFPR,TPR,Thresholds, andAUCof theaveragefunction, respectively. For an example, see Plot Average ROC Curve for Multiclass Classifier.