hist3
(Not recommended) Bivariate histogram plot
hist3 is not recommended. Use histogram2 instead.
Syntax
Description
hist3( creates a bivariate
histogram plot of X)X(:,1) and X(:,2) using
10-by-10 equally spaced bins. The hist3 function displays
the bins as 3-D rectangular bars, and the height of each bar indicates the
number of elements in the bin.
hist3(___,
specifies graphical properties using one or more name-value pair arguments in
addition to the input arguments in the previous syntaxes. For example,
Name,Value)'FaceAlpha',0.5 creates a semitransparent histogram. For
a list of properties, see Surface Properties.
hist3( plots into
the axes specified by ax,___)ax instead of the current axes
(gca). The option ax can precede any
of the input argument combinations in the previous syntaxes.
Examples
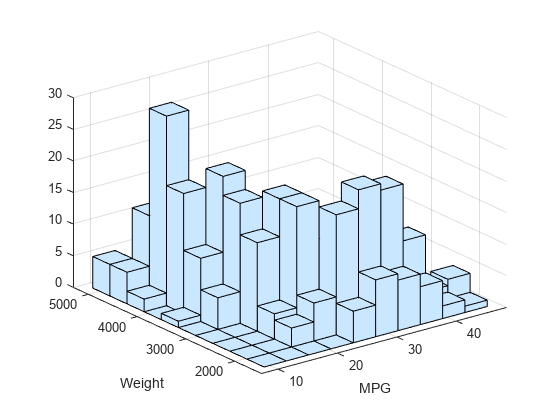
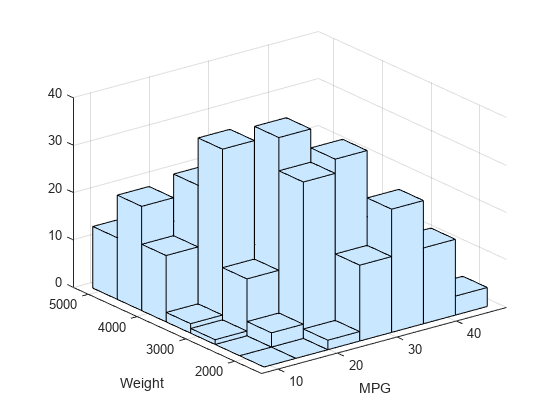
Load the sample data.
load carbigCreate a bivariate histogram with the default settings.
X = [MPG,Weight];
hist3(X)
xlabel('MPG')
ylabel('Weight')
Create a bivariate histogram on the bins specified by the bin centers, and count the number of elements in each bin.
Load the sample data.
load carbigCreate a bivariate histogram. Specify the centers of the histogram bins using a two-element cell array.
X = [MPG,Weight];
hist3(X,'Ctrs',{0:10:50 2000:500:5000})
xlabel('MPG')
ylabel('Weight')
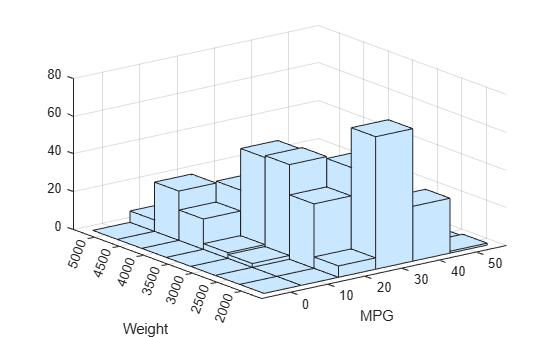
Count the number of elements in each bin.
N = hist3(X,'Ctrs',{0:10:50 2000:500:5000})N = 6×7
0 0 0 0 0 0 0
0 0 2 3 16 26 6
6 34 50 49 27 10 0
70 49 11 3 0 0 0
29 4 2 0 0 0 0
1 0 0 0 0 0 0
Load the sample data.
load carbigCreate a bivariate histogram. Specify graphical properties to color the histogram bars by height representing the frequency of the observations.
X = [MPG,Weight];
hist3(X,'CDataMode','auto','FaceColor','interp')
xlabel('MPG')
ylabel('Weight')
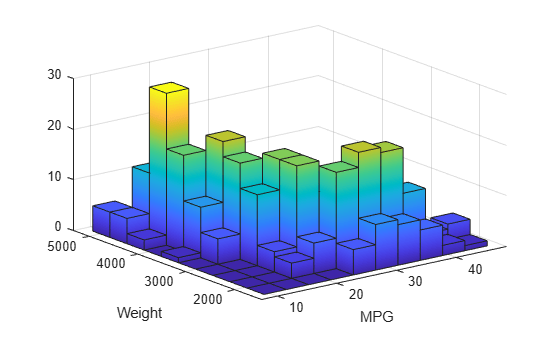
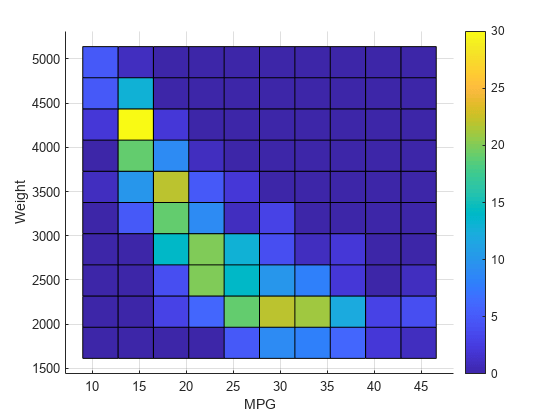
Load the sample data.
load carbigCreate a bivariate tiled histogram. Specify graphical properties to color the top surface of the histogram bars by the frequency of the observations. Change the view to two-dimensional.
X = [MPG,Weight];
hist3(X,'CdataMode','auto')
xlabel('MPG')
ylabel('Weight')
colorbar
view(2)
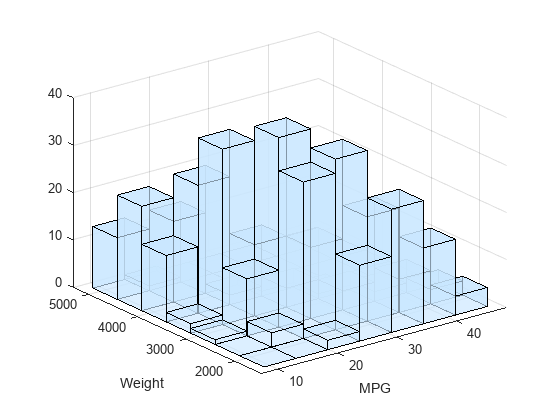
Create a bivariate histogram and adjust its graphical properties by using the handle of the histogram surface object.
Load the sample data.
load carbigCreate a bivariate histogram with 7 bins in each dimension.
X = [MPG,Weight];
hist3(X,'Nbins',[7 7])
xlabel('MPG')
ylabel('Weight')
The hist3 function creates a bivariate histogram, which is a type of surface plot. Find the handle of the surface object and adjust the face transparency.
s = findobj(gca,'Type','Surface');
s.FaceAlpha = 0.65;
Create a bivariate histogram and add the 2-D projected view of intensities to the histogram.
Load the seamount data set (a seamount is an underwater mountain). The data set consists of a set of longitude (x) and latitude (y) locations, and the corresponding seamount elevations (z) measured at those coordinates. This example uses x and y to draw a bivariate histogram.
load seamountDraw a bivariate histogram.
hist3([x,y])
xlabel('Longitude')
ylabel('Latitude')
hold on
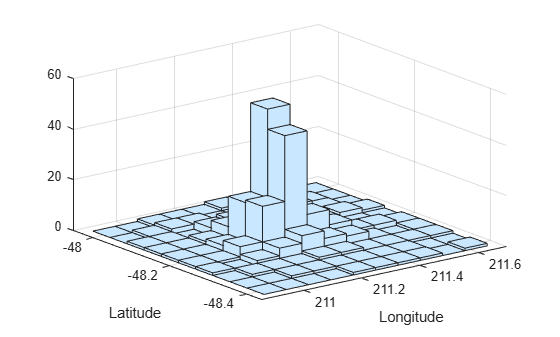
Count the number of elements in each bin.
N = hist3([x,y]);
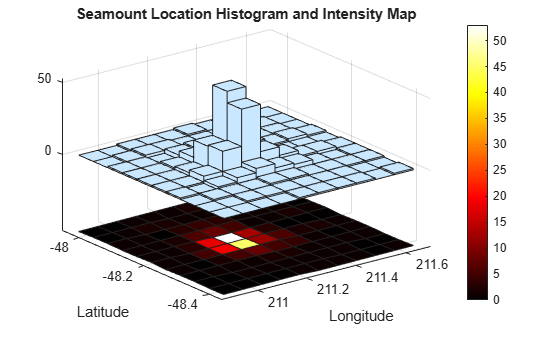
Generate a grid to draw the 2-D projected view of intensities by using pcolor.
N_pcolor = N';
N_pcolor(size(N_pcolor,1)+1,size(N_pcolor,2)+1) = 0;
xl = linspace(min(x),max(x),size(N_pcolor,2)); % Columns of N_pcolor
yl = linspace(min(y),max(y),size(N_pcolor,1)); % Rows of N_pcolor
Draw the intensity map by using pcolor. Set the z-level of the intensity map to view the histogram and the intensity map together.
h = pcolor(xl,yl,N_pcolor);
colormap('hot') % Change color scheme
colorbar % Display colorbar
h.ZData = -max(N_pcolor(:))*ones(size(N_pcolor));
ax = gca;
ax.ZTick(ax.ZTick < 0) = [];
title('Seamount Location Histogram and Intensity Map');
Input Arguments
Name-Value Arguments
Specify optional pairs of arguments as
Name1=Value1,...,NameN=ValueN, where Name is
the argument name and Value is the corresponding value.
Name-value arguments must appear after other arguments, but the order of the
pairs does not matter.
Before R2021a, use commas to separate each name and value, and enclose
Name in quotes.
Example: hist3(X,'FaceColor','interp','CDataMode','auto') colors
the histogram bars according to the height of the bars.
The graphical properties listed here are only a subset. For a full list, see Surface Properties.
Selection mode for CData
(vertex colors), specified as the comma-separated pair consisting of
'CDataMode' and one of these values:
'manual'— Use manually specified values in theCDataproperty. The default color inCDatais light steel blue corresponding to an RGB triple value of[0.75 0.85 0.95].'auto'— Use theZDatavalues to set the colors.ZDatacontains the z-coordinate data for the eight corners of each bar.
Example: 'CDataMode','auto'
Edge line color, specified as the comma-separated pair consisting of
'EdgeColor' and one of these values:
'none'— Do not draw the edges.'flat'— Use a different color for each edge based on the values in theCDataproperty.'interp'— Use interpolated coloring for each edge based on the values in theCDataproperty.RGB triplet, hexadecimal color code, color name, or short name — Use the specified color for all the edges. These values do not use the color values in the
CDataproperty.
The default color of [0 0 0]
corresponds to black edges.
RGB triplets and hexadecimal color codes are useful for specifying custom colors.
An RGB triplet is a three-element row vector whose elements specify the intensities of the red, green, and blue components of the color. The intensities must be in the range
[0,1]; for example,[0.4 0.6 0.7].A hexadecimal color code is a character vector or a string scalar that starts with a hash symbol (
#) followed by three or six hexadecimal digits, which can range from0toF. The values are not case sensitive. Thus, the color codes"#FF8800","#ff8800","#F80", and"#f80"are equivalent.
Alternatively, you can specify some common colors by name. This table lists the named color options, the equivalent RGB triplets, and hexadecimal color codes.
| Color Name | Short Name | RGB Triplet | Hexadecimal Color Code | Appearance |
|---|---|---|---|---|
"red" | "r" | [1 0 0] | "#FF0000" |
|
"green" | "g" | [0 1 0] | "#00FF00" |
|
"blue" | "b" | [0 0 1] | "#0000FF" |
|
"cyan"
| "c" | [0 1 1] | "#00FFFF" |
|
"magenta" | "m" | [1 0 1] | "#FF00FF" |
|
"yellow" | "y" | [1 1 0] | "#FFFF00" |
|
"black" | "k" | [0 0 0] | "#000000" |
|
"white" | "w" | [1 1 1] | "#FFFFFF" |
|
This table lists the default color palettes for plots in the light and dark themes.
| Palette | Palette Colors |
|---|---|
Before R2025a: Most plots use these colors by default. |
|
|
|
You can get the RGB triplets and hexadecimal color codes for these palettes using the orderedcolors and rgb2hex functions. For example, get the RGB triplets for the "gem" palette and convert them to hexadecimal color codes.
RGB = orderedcolors("gem");
H = rgb2hex(RGB);
Before R2023b: Get the RGB triplets using RGB =
get(groot,"FactoryAxesColorOrder").
Before R2024a: Get the hexadecimal color codes using H =
compose("#%02X%02X%02X",round(RGB*255)).
Example: 'EdgeColor','blue'
Face transparency, specified as the comma-separated pair consisting of
'FaceAlpha' and one of these values:
Scalar in the range
[0,1]— Use uniform transparency across all the faces. A value of1is fully opaque and0is completely transparent. Values between0and1are semitransparent. This option does not use the transparency values in theAlphaDataproperty.'flat'— Use a different transparency for each face based on the values in theAlphaDataproperty. The transparency value at the first vertex determines the transparency for the entire face. This value applies only when you specify theAlphaDataproperty and set theFaceColorproperty to'flat'.'interp'— Use interpolated transparency for each face based on the values in theAlphaDataproperty. The transparency varies across each face by interpolating the values at the vertices. This value applies only when you specify theAlphaDataproperty and set theFaceColorproperty to'interp'.'texturemap'— Transform the data inAlphaDataso that it conforms to the surface.
Example: 'FaceAlpha',0.5
Face color, specified as the comma-separated pair consisting of
'FaceColor' and one of these values:
'flat'— Use a different color for each face based on the values in theCDataproperty.'interp'— Use interpolated coloring for each face based on the values in theCDataproperty.'none'— Do not draw the faces.'texturemap'— Transform the color data inCDataso that it conforms to the surface.RGB triplet, hexadecimal color code, color name, or short name — Use the specified color for all the faces. These values do not use the color values in the
CDataproperty.
RGB triplets and hexadecimal color codes are useful for specifying custom colors.
An RGB triplet is a three-element row vector whose elements specify the intensities of the red, green, and blue components of the color. The intensities must be in the range
[0,1]; for example,[0.4 0.6 0.7].A hexadecimal color code is a character vector or a string scalar that starts with a hash symbol (
#) followed by three or six hexadecimal digits, which can range from0toF. The values are not case sensitive. Thus, the color codes"#FF8800","#ff8800","#F80", and"#f80"are equivalent.
Alternatively, you can specify some common colors by name. This table lists the named color options, the equivalent RGB triplets, and hexadecimal color codes.
| Color Name | Short Name | RGB Triplet | Hexadecimal Color Code | Appearance |
|---|---|---|---|---|
"red" | "r" | [1 0 0] | "#FF0000" |
|
"green" | "g" | [0 1 0] | "#00FF00" |
|
"blue" | "b" | [0 0 1] | "#0000FF" |
|
"cyan"
| "c" | [0 1 1] | "#00FFFF" |
|
"magenta" | "m" | [1 0 1] | "#FF00FF" |
|
"yellow" | "y" | [1 1 0] | "#FFFF00" |
|
"black" | "k" | [0 0 0] | "#000000" |
|
"white" | "w" | [1 1 1] | "#FFFFFF" |
|
This table lists the default color palettes for plots in the light and dark themes.
| Palette | Palette Colors |
|---|---|
Before R2025a: Most plots use these colors by default. |
|
|
|
You can get the RGB triplets and hexadecimal color codes for these palettes using the orderedcolors and rgb2hex functions. For example, get the RGB triplets for the "gem" palette and convert them to hexadecimal color codes.
RGB = orderedcolors("gem");
H = rgb2hex(RGB);
Before R2023b: Get the RGB triplets using RGB =
get(groot,"FactoryAxesColorOrder").
Before R2024a: Get the hexadecimal color codes using H =
compose("#%02X%02X%02X",round(RGB*255)).
Example: 'FaceColor','interp'
Line style, specified as the comma-separated pair consisting of
'LineStyle' and one of the options in this
table.
| Line Style | Description | Resulting Line |
|---|---|---|
"-" | Solid line |
|
"--" | Dashed line |
|
":" | Dotted line |
|
"-." | Dash-dotted line |
|
"none" | No line | No line |
Example: 'LineStyle',':'
Line width, specified as the comma-separated pair consisting of
'LineWidth' and a positive value in
points.
Example: 'LineWidth',0.75
Data Types: single | double
Output Arguments
Tips
The hist3 function creates a bivariate histogram, which is a type
of surface plot. You can specify surface properties using one or more name-value pair
arguments. Also, you can change the appearance of the histogram by changing the surface
property values after you create a histogram. Get the handle of the surface object by
using s = findobj(gca,'Type','Surface'), and then use
s to modify the surface properties. For an example, see Adjust Graphical Properties. For a list of properties, see Surface Properties.
Alternative Functionality
The histogram2 function enables you to create a
bivariate histogram using a Histogram2 object. You can use the
name-value pair arguments of histogram2 to use normalization (Normalization),
adjust the width of the bins in each dimension (BinWidth), and display
the histogram as a rectangular array of tiles instead of 3-D bars (DisplayStyle).
Version History
Introduced before R2006a
See Also
accumarray | bar3 | histcounts2 | histogram2 | binScatterPlot