plotPermutationResults
Plot histogram of permutation results for a variable specified for data drift detection
Since R2022a
Syntax
Description
plotPermutationResults( plots
the histogram of metric values computed by the DDiagnostics)driftdetect function
during permutation testing for the variable with the lowest
p-value.
If you set the value of EstimatePValues to
false in the call to detectdrift, then
plotPermutationResults does not generate a plot and, instead,
returns a warning.
plotPermutationResults(
plots the histogram for the variable specified by DDiagnostics,Variable=variable)variable.
H = plotPermutationResults(___)Histogram objects
H for the metric values computed during permutation testing. Use
H to inspect and modify the properties of the histogram. For more
information, see Histogram Properties.
[
additionally returns a H,CL] = plotPermutationResults(___)ConstantLine object CL for
the metric threshold value. Use CL to inspect and modify the
properties of the line. For more information, see ConstantLine Properties.
Examples
Generate baseline and target data with three variables, where the distribution parameters of the second and third variables change for the target data.
rng('default') % For reproducibility
baseline = [normrnd(0,1,100,1),wblrnd(1.1,1,100,1),betarnd(1,2,100,1)];
target = [normrnd(0,1,100,1),wblrnd(1.2,2,100,1),betarnd(1.7,2.8,100,1)];
Perform permutation testing for all variables to check for any drift between the baseline and target data.
DDiagnostics = detectdrift(baseline,target)
DDiagnostics =
  DriftDiagnostics

              VariableNames: ["x1"    "x2"    "x3"]
       CategoricalVariables: []
                DriftStatus: ["Stable"    "Drift"    "Warning"]
                    PValues: [0.3850 0.0050 0.0910]
        ConfidenceIntervals: [2×3 double]
    MultipleTestDriftStatus: "Drift"
             DriftThreshold: 0.0500
           WarningThreshold: 0.1000


  Properties, Methods
Plot the permutation results for the default variable.
plotPermutationResults(DDiagnostics)
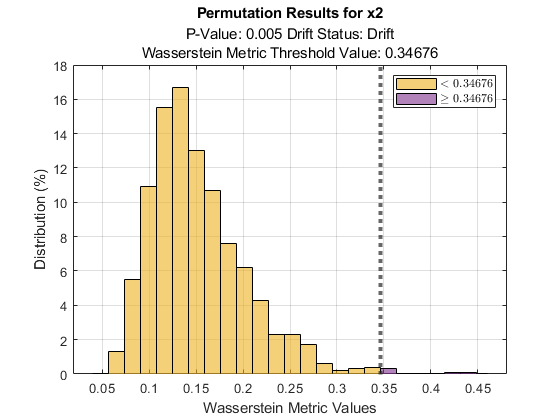
By default, plotPermutationResults plots a histogram of the metric values computed in permutation testing for the variable with the lowest p-value, which is x2 in this case. The function includes the metric threshold value (the initial metric value computed by detectdrift using the baseline and target data) on the histogram, so you can see the values that are greater than or equal to the threshold. plotPermutationResults also displays the p-value and the drift status for the variable, and the metric that you specify to use for permutation testing in the call to detectdrift. In this example, no metric is specified, so detectdrift uses the default metric (Wasserstein) for continuous variables.
Generate baseline and target data with three variables, where the distribution parameters of the second and third variables change for the target data.
rng('default') % For reproducibility
baseline = [normrnd(0,1,100,1),wblrnd(1.1,1,100,1),betarnd(1,2,100,1)];
target = [normrnd(0,1,100,1),wblrnd(1.2,2,100,1),betarnd(1.7,2.8,100,1)];
Perform permutation testing for all variables to check for any drift between the baseline and target data. Use the Energy metric for all variables.
DDiagnostics = detectdrift(baseline,target,ContinuousMetric="energy")DDiagnostics =
DriftDiagnostics
VariableNames: ["x1" "x2" "x3"]
CategoricalVariables: []
DriftStatus: ["Stable" "Drift" "Warning"]
PValues: [0.3790 0.0110 0.0820]
ConfidenceIntervals: [2×3 double]
MultipleTestDriftStatus: "Drift"
DriftThreshold: 0.0500
WarningThreshold: 0.1000
Properties, Methods
Display the 95% confidence bounds for the p-values.
DDiagnostics.ConfidenceIntervals
ans = 2×3

    0.3488    0.0055    0.0657
    0.4099    0.0196    0.1008
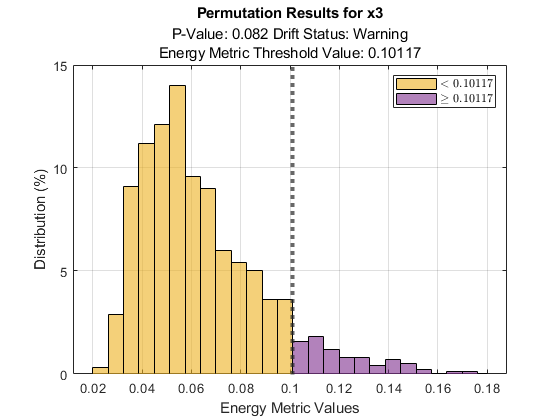
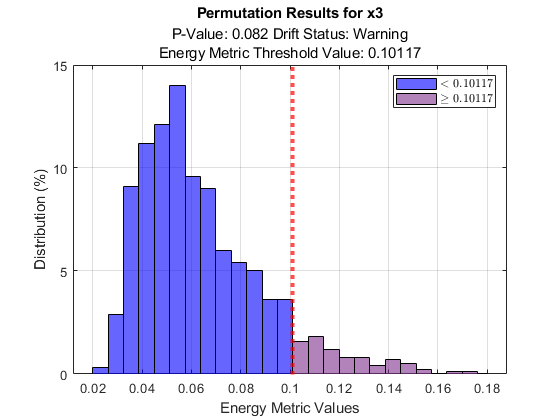
Plot the permutation results for the third variable.
plotPermutationResults(DDiagnostics,Variable=3)
Generate baseline and target data with three variables, where the distribution parameters of the second and third variables change for the target data.
rng('default') % For reproducibility
baseline = [normrnd(0,1,100,1),wblrnd(1.1,1,100,1),betarnd(1,2,100,1)];
target = [normrnd(0,1,100,1),wblrnd(1.2,2,100,1),betarnd(1.7,2.8,100,1)];
Perform permutation testing for all variables to check for any drift between the baseline and target data. Use the Energy metric for all variables.
DDiagnostics = detectdrift(baseline,target,ContinuousMetric="energy")DDiagnostics =
DriftDiagnostics
VariableNames: ["x1" "x2" "x3"]
CategoricalVariables: []
DriftStatus: ["Stable" "Drift" "Warning"]
PValues: [0.3790 0.0110 0.0820]
ConfidenceIntervals: [2×3 double]
MultipleTestDriftStatus: "Drift"
DriftThreshold: 0.0500
WarningThreshold: 0.1000
Properties, Methods
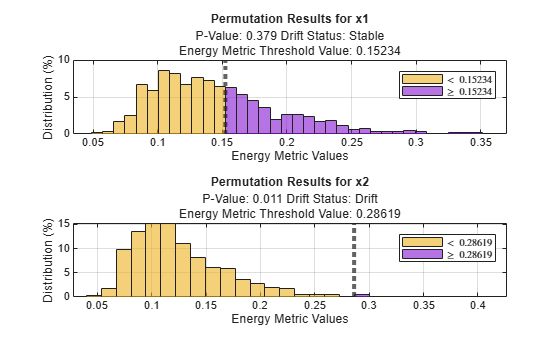
Plot the permutation results for variables x1 and x2 in a tiled layout.
tiledlayout(2,1);
ax1 = nexttile;
plotPermutationResults(DDiagnostics,ax1,Variable="x1")
ax2 = nexttile;
plotPermutationResults(DDiagnostics,ax2,Variable="x2")
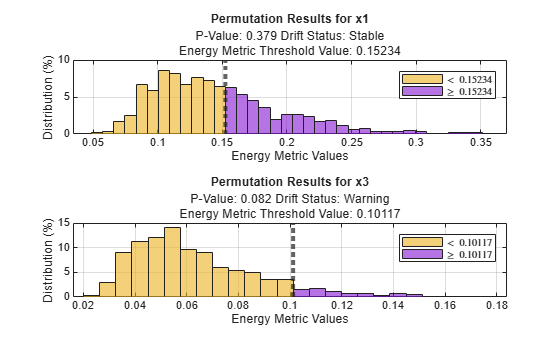
Plot the permutation results for variables x1 and x3 in a tiled layout.
tiledlayout(2,1);
ax1 = nexttile;
plotPermutationResults(DDiagnostics,ax1,Variable="x1")
ax3= nexttile;
plotPermutationResults(DDiagnostics,ax3,Variable="x3")
Generate baseline and target data with three variables, where the distribution parameters of the second and third variables change for the target data.
rng('default') % For reproducibility
baseline = [normrnd(0,1,100,1),wblrnd(1.1,1,100,1),betarnd(1,2,100,1)];
target = [normrnd(0,1,100,1),wblrnd(1.2,2,100,1),betarnd(1.7,2.8,100,1)];
Perform permutation testing for all variables to check for any drift between the baseline and target data. Use the Energy distance as the metric.
DDiagnostics = detectdrift(baseline,target,ContinuousMetric="energy")DDiagnostics =
DriftDiagnostics
VariableNames: ["x1" "x2" "x3"]
CategoricalVariables: []
DriftStatus: ["Stable" "Drift" "Warning"]
PValues: [0.3790 0.0110 0.0820]
ConfidenceIntervals: [2×3 double]
MultipleTestDriftStatus: "Drift"
DriftThreshold: 0.0500
WarningThreshold: 0.1000
Properties, Methods
Plot the permutation results for the third variable.
[H,CL] = plotPermutationResults(DDiagnostics,Variable=3)

H =
  2×1 Histogram array:

  Histogram
  Histogram
CL =
  ConstantLine with properties:

    InterceptAxis: 'x'
            Value: 0.1012
            Color: [0.1500 0.1500 0.1500]
        LineStyle: ':'
        LineWidth: 3
            Label: ''
      DisplayName: ''

  Show all properties
Change the histogram bar colors to blue and the threshold line color to red.
H(1).FaceColor = "b";
CL.Color = "r";
You can also access and modify properties by double-clicking H or CL in the Workspace to open and use the Property Inspector.
Input Arguments
Output Arguments
Version History
Introduced in R2022a
See Also
detectdrift | DriftDiagnostics | plotDriftStatus | plotEmpiricalCDF | plotHistogram | ecdf | summary | histcounts