Check Model Performance Using Test Data Set in Regression Learner App
This example shows how to train multiple models in the Regression Learner app, and determine the best-performing models based on their validation metrics. Check the test metrics for the best-performing models using the test data set.
In the MATLAB® Command Window, load the
carbigdata set, and create a table containing most of the variables. Separate the table into training and test sets.load carbig cartable = table(Acceleration,Cylinders,Displacement, ... Horsepower,Model_Year,Weight,Origin,MPG); rng("default") % For reproducibility of the data split n = length(MPG); partition = cvpartition(n,Holdout=0.15); idxTrain = training(partition); % Indices for the training set cartableTrain = cartable(idxTrain,:); cartableTest = cartable(~idxTrain,:);
Alternatively, you can create a test set later on when you import data into the app. For more information, see Test Trained Models in Classification Learner or Regression Learner.
Open Regression Learner using the
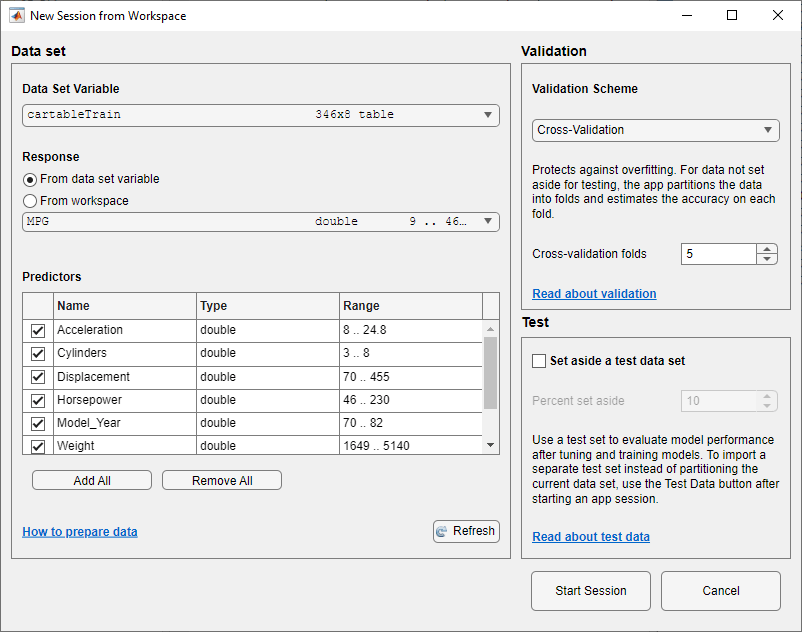
cartableTraintable and theMPGvariable as the response.regressionLearner(cartableTrain,"MPG")
The predictor and response variables are indicated in the New Session from Arguments dialog box. To protect against overfitting, the default validation option is 5-fold cross-validation. To accept the default settings and continue, click Start Session.
Train all preset models. In the Models section of the Learn tab, click All. In the Train section, click Train All and select Train All. The app trains one of each preset model type, along with the default fine tree model, and displays the models in the Models pane.
Note
If you have Parallel Computing Toolbox™, then the Use Parallel button is selected by default. After you click Train All and select Train All or Train Selected, the app opens a parallel pool of workers. During this time, you cannot interact with the software. After the pool opens, you can continue to interact with the app while models train in parallel.
If you do not have Parallel Computing Toolbox, then the Use Background Training check box in the Train All menu is selected by default. After you select an option to train models, the app opens a background pool. After the pool opens, you can continue to interact with the app while models train in the background.
Sort the trained models based on the validation root mean squared error (RMSE). In the Models pane, open the Sort by list and select
RMSE (Validation).In the Models pane, click the star icons next to the three models with the lowest validation RMSE. The app highlights the lowest validation RMSE by outlining it in a box. In this example, the trained Exponential GPR model has the lowest validation RMSE.

The app displays a response plot for the linear regression model (model 2.1). Blue points are true values, and yellow points are predicted values. The Models pane on the left shows the validation RMSE for each model.
Note
Validation introduces some randomness into the results. Your model validation results can vary from the results shown in this example.
Check the test set performance of the best-performing models. Begin by importing test data into the app.
On the Test tab, in the Data section, click Import Test Data and select From Workspace.
In the Import Test Data dialog box, select the
cartableTesttable from the Test Data Set Variable list.As shown in the dialog box, the app identifies the response and predictor variables.
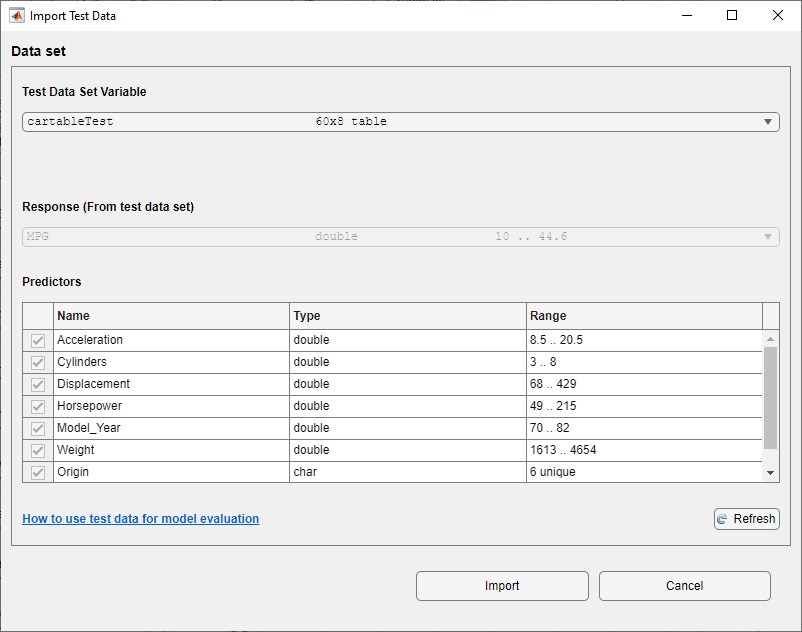
Click Import.
Compute the RMSE of the best preset models on the
cartableTestdata. Select the first starred model in the Models pane. On the Test tab, in the Test section, click Test Selected. The app computes the test data set performance of the model (which was trained on the training data set).Repeat the previous step for the other two starred models. Close the Testing Multiple Models dialog box each time by clicking OK (or select the check box in the dialog box to hide it for the rest of the app session).
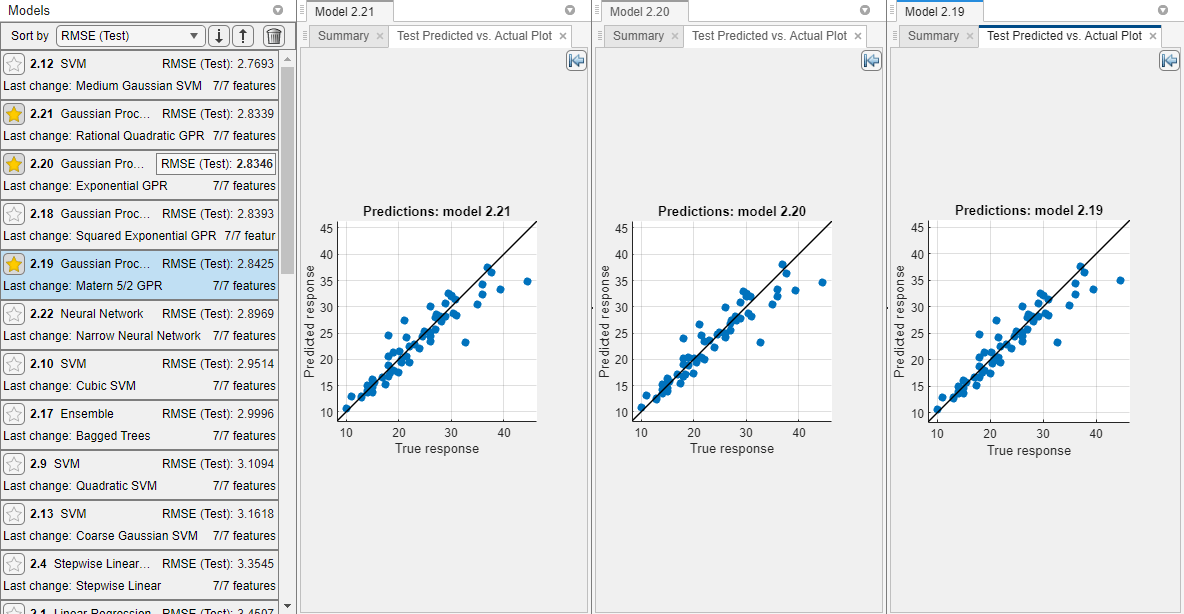
Sort the models based on the test set RMSE. In the Models pane, open the Sort by list and select
RMSE
                        (Test)
. The app still outlines the metric for the model with the lowest validation RMSE, despite displaying the test RMSE.Visually check the test set performance of the models. For each starred model, select the model in the Models pane. On the Test tab, in the Plots and Results section, click Predicted vs. Actual (Test).
Rearrange the layout of the plots to better compare them. First, close the summary and plot tabs for Model 1 and Model 2.1. Then, click the Document Actions button
 located to the far right of the model plot tabs. Select the
Tile Alloption and specify a 1-by-3 layout. Click the Hide plot options button at the top right of the plots to make more
room for the plots.
at the top right of the plots to make more
room for the plots.In this example, the three starred models perform similarly on the test set data.
To return to the original layout, you can click the Layout button in the Plots and Results section and select Single model (Default).
Compare the validation and test RMSE for the trained Exponential GPR model. In the Models pane, double-click the model. In the model Summary tab, compare the RMSE (Validation) value under Training Results to the RMSE (Test) value under Test Results. In this example, the validation RMSE is lower than the test RMSE, which indicates that the validation RMSE might be overestimating the performance of this model.