predictConstraints
Predict coupled constraint violations at a set of points
Syntax
Description
ConstraintViolations = predictConstraints(results,XTable)XTable.
[
also returns the standard deviations of the coupled constraint functions.ConstraintViolations,sigma]
= predictConstraints(results,XTable)
Examples
This example shows how to predict the coupled constraints of an optimized SVM model. For details of this model, see Optimize Cross-Validated Classifier Using bayesopt.
rng default
grnpop = mvnrnd([1,0],eye(2),10);
redpop = mvnrnd([0,1],eye(2),10);
redpts = zeros(100,2);
grnpts = redpts;
for i = 1:100
    grnpts(i,:) = mvnrnd(grnpop(randi(10),:),eye(2)*0.02);
    redpts(i,:) = mvnrnd(redpop(randi(10),:),eye(2)*0.02);
end
cdata = [grnpts;redpts];
grp = ones(200,1);
grp(101:200) = -1;
c = cvpartition(200,'KFold',10);
sigma = optimizableVariable('sigma',[1e-5,1e5],'Transform','log');
box = optimizableVariable('box',[1e-5,1e5],'Transform','log');
The objective function is the cross-validation loss of the SVM model for the partition c. The coupled constraint is the number of support vectors in the model minus 100. The model has 200 data points, so the coupled constraint values range from -100 to 100. Positive values mean the constraint is not satisfied.
function [objective,constraint] = mysvmfun(x,cdata,grp,c)
SVMModel = fitcsvm(cdata,grp,'KernelFunction','rbf',...
    'BoxConstraint',x.box,...
    'KernelScale',x.sigma);
cvModel = crossval(SVMModel,'CVPartition',c);
objective = kfoldLoss(cvModel);
constraint = sum(SVMModel.IsSupportVector)-100.5;
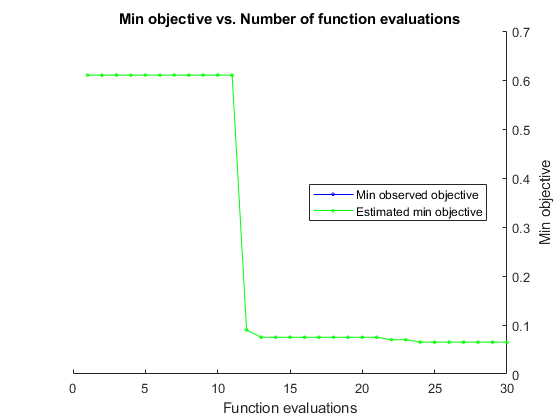
Call the optimizer using this function and its one coupled constraint.
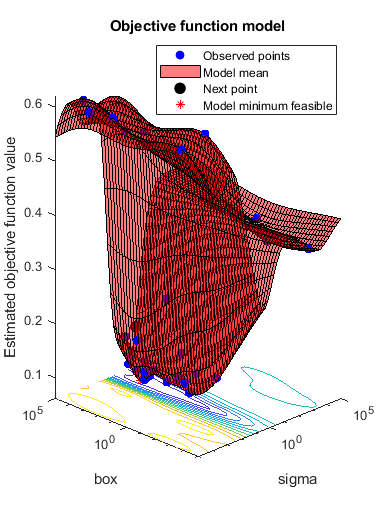
fun = @(x)mysvmfun(x,cdata,grp,c);
results = bayesopt(fun,[sigma,box],'IsObjectiveDeterministic',true,...
    'NumCoupledConstraints',1,'PlotFcn',...
    {@plotMinObjective,@plotConstraintModels,@plotObjectiveModel},...
    'AcquisitionFunctionName','expected-improvement-plus','Verbose',0);
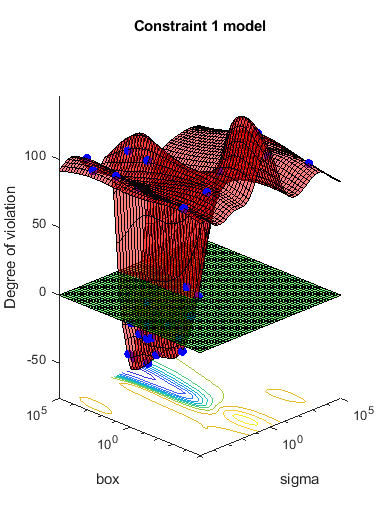
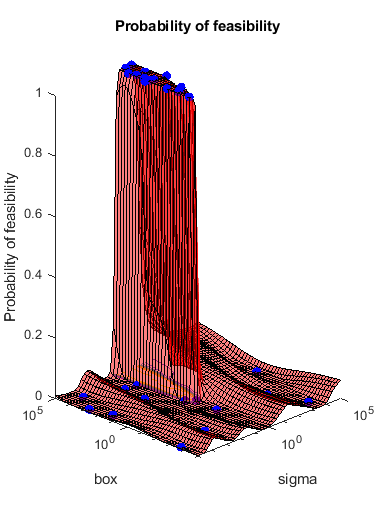
The constraint model plot shows that most parameters in the range are infeasible, and are feasible only for relatively high values of the box parameter and a small range of the sigma parameter. Predict the coupled constraint values for several values of the control variables box and sigma.
sigma = logspace(-2,2,11)';
box = logspace(0,5,11)';
XTable = table(sigma,box);
cons = predictConstraints(results,XTable);
[XTable,table(cons)]
ans =

  11×3 table

     sigma       box       cons
    ________    ______    _______

        0.01         1     99.539
    0.025119    3.1623     106.74
    0.063096        10     94.781
     0.15849    31.623     25.242
     0.39811       100     -38.79
           1    316.23    -56.379
      2.5119      1000    -34.247
      6.3096    3162.3     4.9263
      15.849     10000     39.193
      39.811     31623      60.69
         100     1e+05      71.82