Main Content

convertToChart

Convert state transition table to Stateflow chart

Since R2023b

Description

chart = convertToChart(table) converts the unlocked state transition table table to a Stateflow® chart.

example

Examples

collapse all

This example shows how to convert a state transition table to a Stateflow® chart.

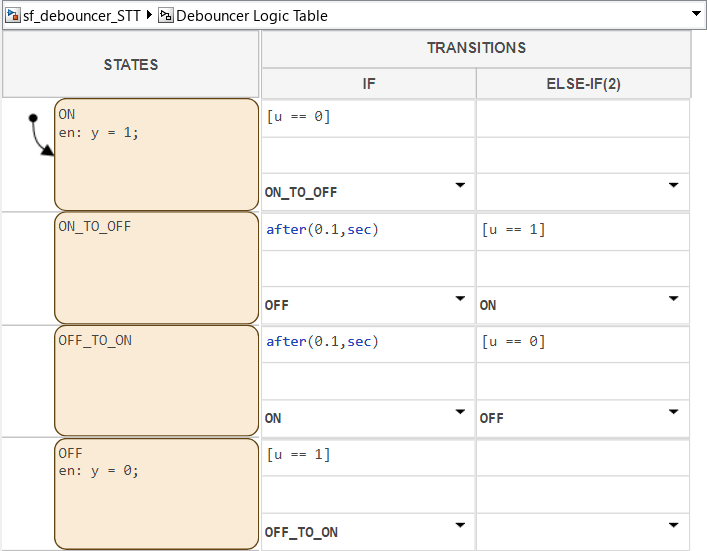
Open the example model and access the Stateflow.StateTransitionTableChart object.

open_system("sf_debouncer_STT")
table = find(sfroot,"-isa","Stateflow.StateTransitionTableChart");
view(table)

State transition table that contains four states, ON, ON_TO_OFF, OFF_TO_ON, and OFF. The table sets the output data y to 1 when state ON is active and to 0 when state OFF is active.

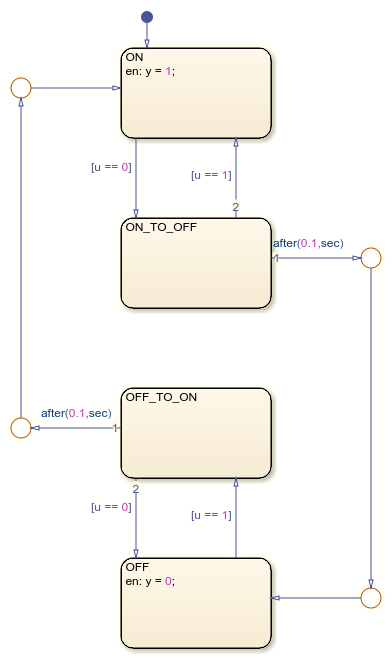
Convert the state transition table to a Stateflow chart.

chart = convertToChart(table);
view(chart)

Chart that represents the same logic as the original state transition table. The chart contains four states, ON, ON_TO_OFF, OFF_TO_ON, and OFF. The table sets the output data y to 1 when state ON is active and to 0 when state OFF is active.

Input Arguments

collapse all

Stateflow state transition table to convert, specified as a Stateflow.StateTransitionTableChart object.

Version History

Introduced in R2023b