Generate Gridded Parameter Values
Instead of drawing random sets of parameter values for sensitivity analysis, you can explore the sensitivity of design requirements across a specified grid of parameter values. As with random parameter values, you can generate gridded parameter values in the Sensitivity Analyzer app or at the command line.
Generate Gridded Parameter Values in Sensitivity Analyzer
You can generate gridded parameters in the app after you have created a parameter set.
Create a parameter set.
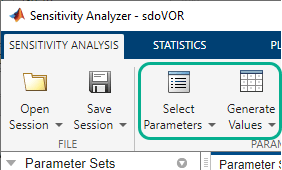
In the Sensitivity Analyzer, in the Sensitivity Analysis tab, click Select Parameters.
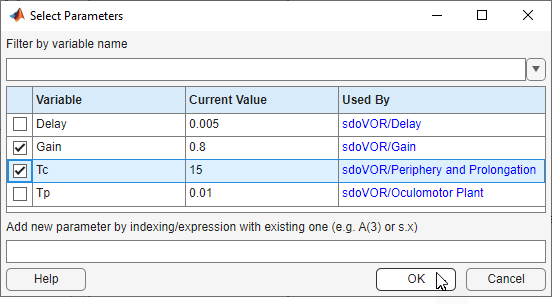
In the Select Parameters dialog box, select all the parameters you want to include in your parameter set, and click OK.
A
ParamSetvariable is created in the Parameter Sets area of the app. The current value for each parameter in the parameter set is displayed in a table.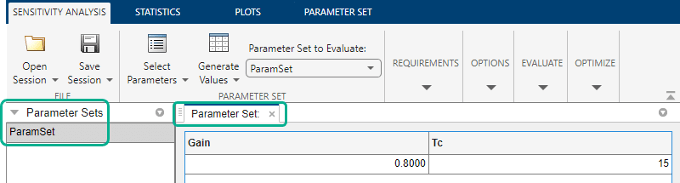
Specify the starting parameter values and gridding method for grid generation.
In the Sensitivity Analysis tab, click Generate Values, and select Generate Gridded Values from the drop-down menu.
In the Generate Gridded Parameter Values dialog box, specify the gridding method as All Combinations. The app generates all possible combinations of the values specified in Values.
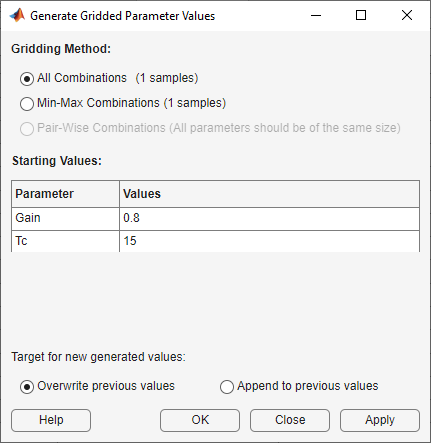
Specify the starting parameter values in Values. The values you enter here determine the parameter space. To see the other ways to specify starting parameter values and gridding methods, click Help.
![Specify the starting values for Gain as [0.7, 0.8, 0.9] and Tc as [13:1:17]](sa_sdovor_griddded_values_specifed.png)
Generate the parameters.
Click Overwrite. The parameter set table updates with the generated gridded parameter values.
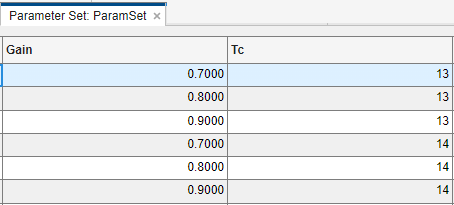
You can also append the generated values to previously generated random or gridded parameter values in the parameter set table. To do so, click Append.
(Optional) Plot the generated values.
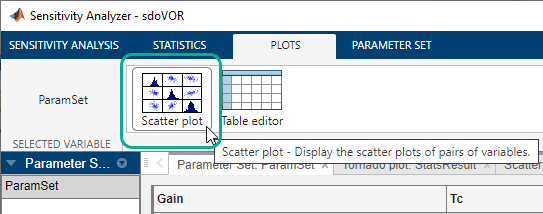
In the Parameter Sets area of the app, select ParamSet. In the Plots tab of the app, select Scatter Plot from the plots gallery.
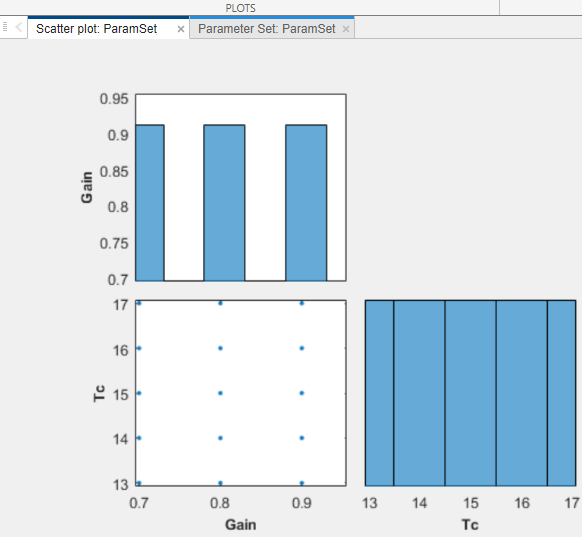
Plots are generated with histograms of the distribution of the parameter values shown on the diagonals. The off-diagonal plots display the scatter plots between pairs of parameters. To learn more about the plots, see Interact with Plots in Sensitivity Analyzer.
Generate Gridded Parameter Values Programmatically
To generate gridded parameter values at the command line or in a script or
function, use sdo.GriddedSpace to define a parameter space. The parameter space
specifies the parameters to vary and the grid of values over which the parameters
vary. Provide the gridded parameter space to sdo.sample to generate the samples that you then pass to
sdo.evaluate for analysis.
When you sample over a gridded parameter space, you can generate either exhaustive or sequential samples.
Exhaustive sampling generates all possible combinations of parameter values. For instance, for parameters
Awith values{1 2 3}andBwith values{-10 -20 -30 -40}, the sample set contains all twelve combinations(1, -10), (1, -20), (1, -30), …, (3, -20), (3, -30), (3, -40).Sequential sampling generates only pairwise combinations of parameters. For instance, for parameters
A,B, andCwithNvalues each, the sample set contains only the combinations(A1, B1, C1), (A2, B2, C2), …, (AN, BN, CN).
For details and examples about creating and configuring parameter spaces for
gridded sampling, see sdo.GriddedSpace.
Parameter Sets with Both Gridded and Randomly Sampled Parameters
You can also use sdo.GriddedSpace to create composite sample
sets in which some parameters are sampled across grids and others are randomly
sampled. To do so:
Define the gridded parameters with
sdo.GriddedSpace.Define the random parameters with
sdo.ParameterSpace.Join the parameters into a composite space using
combine.
For details and examples about creating and sampling composite parameter
spaces, see combine.
Manual Grid Specification
Before R2023a: To generate gridded parameter values at
the command line, use meshgrid to specify the grid and
create a table of values, as shown in the following example. Suppose that you
have a Simulink® model, myModel, with parameters
A and B. Generate a grid of samples,
where A takes values [2,3,4] and
B takes values [20,30,40].
Extract the parameters from the model as a vector of
param.Continuousobjects.p = sdo.getParameterFromModel('myModel',{'A','B'});
Specify the parameter values for grid generation.
Avals = [2 3 4];
Bvals = [20 30 40];
Create a table of the gridded parameter values. Specify one column for each parameter and one row for each sample. The column names must be the same as the parameter names.
[Agrid,Bgrid] = meshgrid(Avals,Bvals);
values = table(Agrid(:),Bgrid(:),'VariableNames',{'A','B'});
values =

    A    B
    _    __

    2    20
    2    30
    2    40
    3    20
    3    30
    3    40
    4    20
    4    30
    4    40
Pass the table to
sdo.evaluateto analyze how these variations inAandBaffect your design requirements. For instance, suppose that you have defined a cost functiondesign.mthat captures your design requirements.[yR,infoR] = sdo.evaluate(@design,p,values);
See Also
sdo.GriddedSpace | sdo.sample | sdo.scatterPlot | combine