sdo.scatterPlot
Scatter plot of samples
Description
Examples
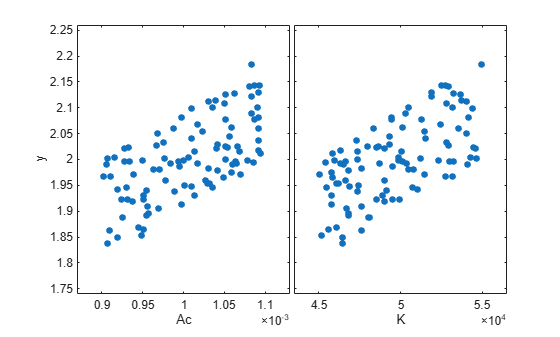
Generally, you use the sdo.scatterPlot(X,Y) syntax with X specifying the samples and Y specifying the cost function value for each sample. Use the sdo.evaluate command to perform the cost function evaluation to generate Y. For this example, obtain 100 samples of the Ac and K parameters of the sdoHydraulicCyclinder model. Calculate the cost function as a function of Ac and K. Create a scatter plot to see the sample and cost function values.
Load the sdoHydraulicCyclinder model.
load_system('sdoHydraulicCylinder');Generate 100 samples of the Ac and K parameters.
p = sdo.getParameterFromModel('sdoHydraulicCylinder',{'Ac','K'});
ps = sdo.ParameterSpace(p);
X = sdo.sample(ps,100);
The first operation obtains the Ac and K parameters as a vector, p. The second operation creates an sdo.ParameterSpace object, ps, that specifies the probability distributions of the parameter samples. The third operation generates 100 samples of each parameter, returned as a Table, X.
Calculate the cost function value table.
Ac_mean = mean(X{:,1});
K_mean = mean(X{:,2});
Y = table(X{:,1}/Ac_mean+X{:,2}/K_mean,'VariableNames',{'y'});
Create a scatter plot of X and Y.
sdo.scatterPlot(X,Y);
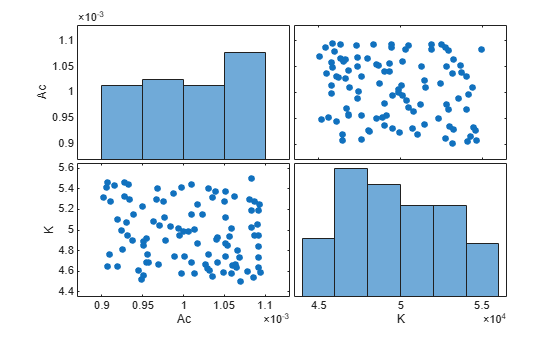
Sample the Ac and K parameters of the sdoHydraulicCyclinder model. Use a scatter plot to analyze the samples.
Load the sdoHydraulicCyclinder model.
load_system('sdoHydraulicCylinder');Generate 100 samples of the Ac and K parameters.
p = sdo.getParameterFromModel('sdoHydraulicCylinder',{'Ac','K'});
ps = sdo.ParameterSpace(p);
X = sdo.sample(ps,100);
The first operation obtains the Ac and K parameters as a vector, p. The second operation creates an sdo.ParameterSpace object, ps, that specifies the probability distributions of the parameter samples. The third operation generates 100 samples of each parameter, returned as a Table, X.
Create a scatter plot of X.
sdo.scatterPlot(X);
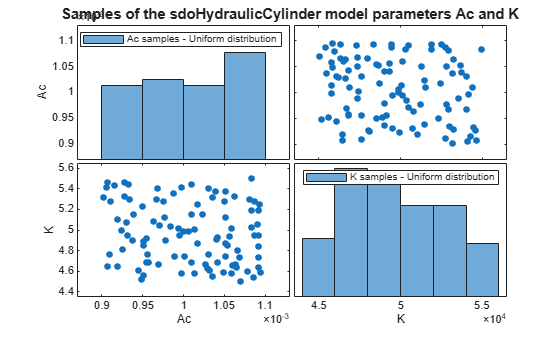
Generate samples of the Ac and K parameters of the sdoHydraulicCyclinder model.
load_system('sdoHydraulicCylinder');
p = sdo.getParameterFromModel('sdoHydraulicCylinder',{'Ac','K'});
ps = sdo.ParameterSpace(p);
X = sdo.sample(ps,100);
Create a scatter plot matrix and return the object handles and the axes handles.
figure
[H,AX,BigAX,P,PAx] = sdo.scatterPlot(X);

To set properties for the scatter plots, use the handles in H. To set properties for the histograms, use the patch handles in P. To set axes properties, use the axes handles, Ax, BigAX, and PAx.
Specify a title for the plot matrix and add legends specifying the sample distribution for each parameter.
title('Samples of the sdoHydraulicCylinder model parameters Ac and K')
legend(PAx(1),'Ac samples - Uniform distribution')
legend(PAx(2),'K samples - Uniform distribution')
Input Arguments
Output Arguments
Version History
Introduced in R2014a