Online Frequency Response Estimation During Simulation
This example shows how to use the Frequency Response Estimator block to perform online frequency response estimation during simulation of the model in Simulink®. This approach can be useful when you plan to deploy the block for online estimation of a physical plant. Testing the estimation algorithm and experiment parameters against a Simulink model of the plant before deployment can help ensure that online estimation is safe for your plant.
Control System Model
This example uses a model that already contains the Frequency Response Estimator block configured for estimation. Open the model.
mdl = "OnlineFreqRespEstimEx.slx";
open_system(mdl)
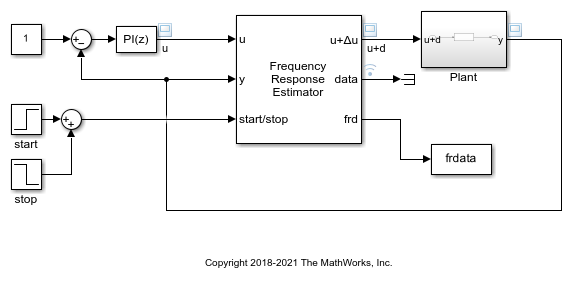
The model contains a plant in a closed-loop configuration with a PI controller. The Frequency Response Estimator block accepts the control signal as the input u. It feeds the control signal plus a perturbation into the plant input. You specify properties of the perturbation signal using parameters of the block.
Experiment Parameters
The Frequency Response Estimator block is configured to run the experiment in sinestream mode, which means that it injects a separate perturbation at each frequency. The block is also configured to use the same amplitude, 1, for each frequency in the perturbation signal.
The block is further configured to estimate frequency responses at the frequencies w = logspace(0,2,20). To ensure that the experiment sampling rate is fast enough to accommodate the highest frequency, it is a good practice to set the sampling time to about 0.6 / wmax or faster, where wmax is the highest frequency in rad/s. For this example, the experiment sample time is 0.005 seconds, is fast enough for the wmax of 100 rad/s.
Start/Stop Signal
The step blocks connected to the start/stop input port turn the experiment on with a rising signal at t = 5, when the model is at steady state. The block provides a recommended experiment length of about 174 s. This value is based on the specified frequencies w, the number of settling periods to wait at each frequency, and the number of periods to use for estimation. To ensure that the experiment runs long enough for a good result, the start/stop signal stops the experiment at t = 180. For details about the recommended experiment length, see Frequency Response Estimator.
Estimation Results
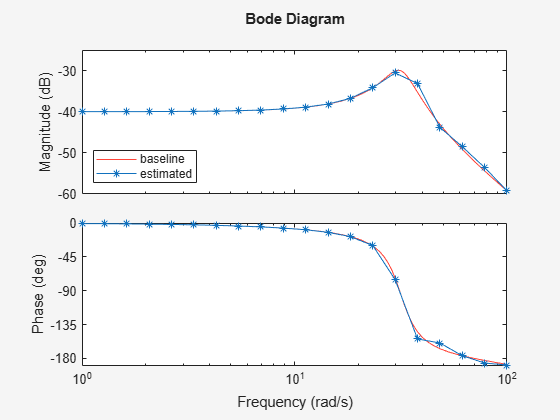
Simulate the model. You can use the scope to visualize the control signal, the perturbation signal, and the plant output. Because the Display Bode Plot block parameter is selected, the block automatically generates a plot of the specified baseline model and updates it periodically with the estimated frequency response.
sim(mdl)
The signal at the frd port is a vector containing the current values of the estimated response at each frequency in w. The To Workspace block connected to that port writes the signal to the MATLAB® workspace variable frdata. In the To Workspace block, the Limit data points to last parameter is set to 1, so that frdata contains only the final estimated responses at each frequency. Convert frdata to a frd model object.
sys_estim = frd(frdata,w);
size(sys_estim)
FRD model with 1 outputs, 1 inputs, and 20 frequency points.
You can now use sys_estim with Control System Toolbox™ analysis and control design commands that accept frd models as input, such as bode and pidtune. Alternatively, if you have System Identification Toolbox™ software, you can use the frequency response data to estimate a parametric model of your system.
Logged Experiment Data
The model is also configured to log the estimation data at the block output port data (see Save Signal Data Using Signal Logging for information about data logging). The data is stored in the MATLAB workspace as the Simulink.SimulationData.Dataset object logsout. For information about how to use this data, see Collect Frequency Response Experiment Data for Offline Estimation.