View Simulation Data in Simulation Data Inspector
You can use the Simulation Data Inspector to visualize data you generate throughout the design process, including data that you log during a simulation. You can also import test data and other recorded data into the Simulation Data Inspector to inspect and analyze it alongside the logged simulation data. For more information about importing data to the Simulation Data Inspector, see Import Data from Workspace or File into Simulation Data Inspector.
Simulation data that you log in a Simulink® model logs to the Simulation Data Inspector. The Simulation Data Inspector offers several types of plots, which allow you to easily create complex visualizations of your data. For more information, see Create Plots Using the Simulation Data Inspector.
View Logged Data
Many types of logged data automatically stream to the Simulation Data Inspector when you simulate a model. Data that streams to the Simulation Data Inspector is also available after simulation. Other types of logged simulation data only appear in the Simulation Data Inspector when the simulation is paused, stopped, or complete. To view these types of logged data, open the Configuration Parameters dialog box and, in the Data Import/Export pane, select Record logged workspace data in Simulation Data Inspector. For more information about logging simulation data, see Save Simulation Data.
| Type of Simulation Data | Data That Can Be Viewed During and After Simulation | Data That Can Be Viewed Only After Simulation is Paused, Stopped, or Complete |
|---|---|---|
| Output | Output data logged using | Output data logged in a format other than
|
| Signal data | Signal data logged using one of these techniques:
| When the Record logged workspace data in Simulation Data Inspector parameter is selected, signal data logged using:
|
| State | State data logged using | State data logged in a format other than
|
| Data store | All data store data | Not applicable |
Note
When you log states and outputs using the Structure or
Array format, you must also log time for the data to
record to the Simulation Data Inspector.
The Simulation Data Inspector displays available data in a table in the Inspect pane. To plot a signal, select the check box next to the signal. You can modify the layout and add different visualizations to analyze the simulation data.
The Simulation Data Inspector manages incoming simulation data using the archive. By default, the previous run moves to the archive when you start a new simulation. You can plot signals from the archive, or you can drag runs of interest back into the work area.
View Complex Data
The complexSignal model logs two complex signals. The Complex Square Wave signal is logged using an Outport block. The Complex Sine Wave signal is logged using signal logging. Open the model.
mdl = "complexSignal";
open_system(mdl)
Simulate the model. Then, plot the simulation data in the Simulation Data Inspector.
out = sim(mdl);
Simulink.sdi.plot(out);
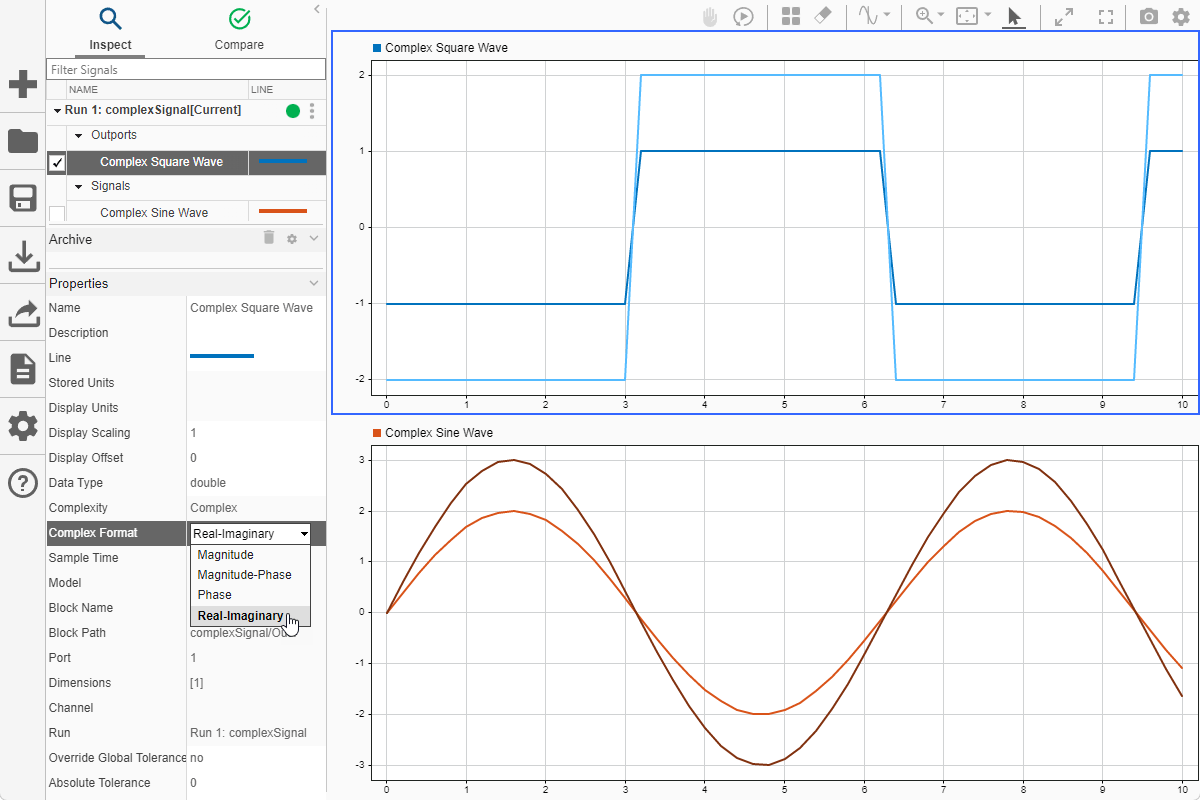
You can control how to visualize a complex signal using the Properties pane in the Simulation Data Inspector. You can choose from these complex format options:
MagnitudeMagnitude-PhasePhaseReal-Imaginary
Select the Complex Square Wave signal from the signal table. Then, in the Complex Format drop-down menu, select Real-Imaginary. If you select Magnitude-Phase or Real-Imaginary for the Complex Format, the Simulation Data Inspector plots both components of the signal. For signals in Real-Imaginary format, the Line Color specifies the color of the real component of the signal, and the imaginary component is a different shade of the Line Color.
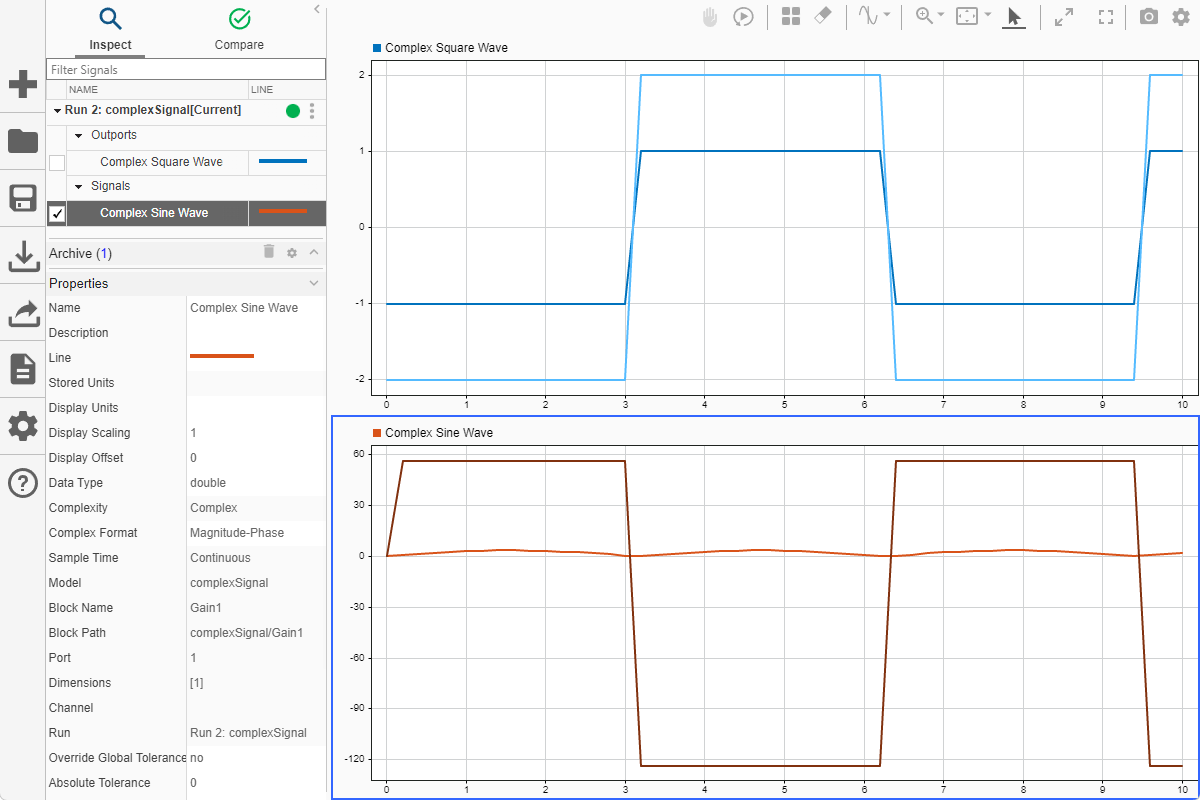
When you use signal logging to log data, you can also change the default complex format for the signal using the Instrumentation Properties for the signal in the model. To access the Instrumentation Properties for the Complex Sine Wave signal, right-click the logging badge for the signal and select Properties. From the Complex Format drop-down menu, select Magnitude-Phase.
Simulate the model again to visualize the Complex Sine Wave signal in the Simulation Data Inspector using the Magnitude-Phase format.
out = sim(mdl);
View String Data
You can log and view string data with your signal data in the Simulation Data Inspector. In the model stringData, the value of the sine wave block controls whether the switch sends a string reading Positive or Negative to the output. Open the model.
mdl = "stringData";
open_system(mdl)
Simulate the model.
out = sim(mdl);
Open the Simulation Data Inspector.
Simulink.sdi.view
Select the Sine Wave and Switch signals from the signal table to plot the results. The string signal is shown at the bottom of the graphical viewing area.
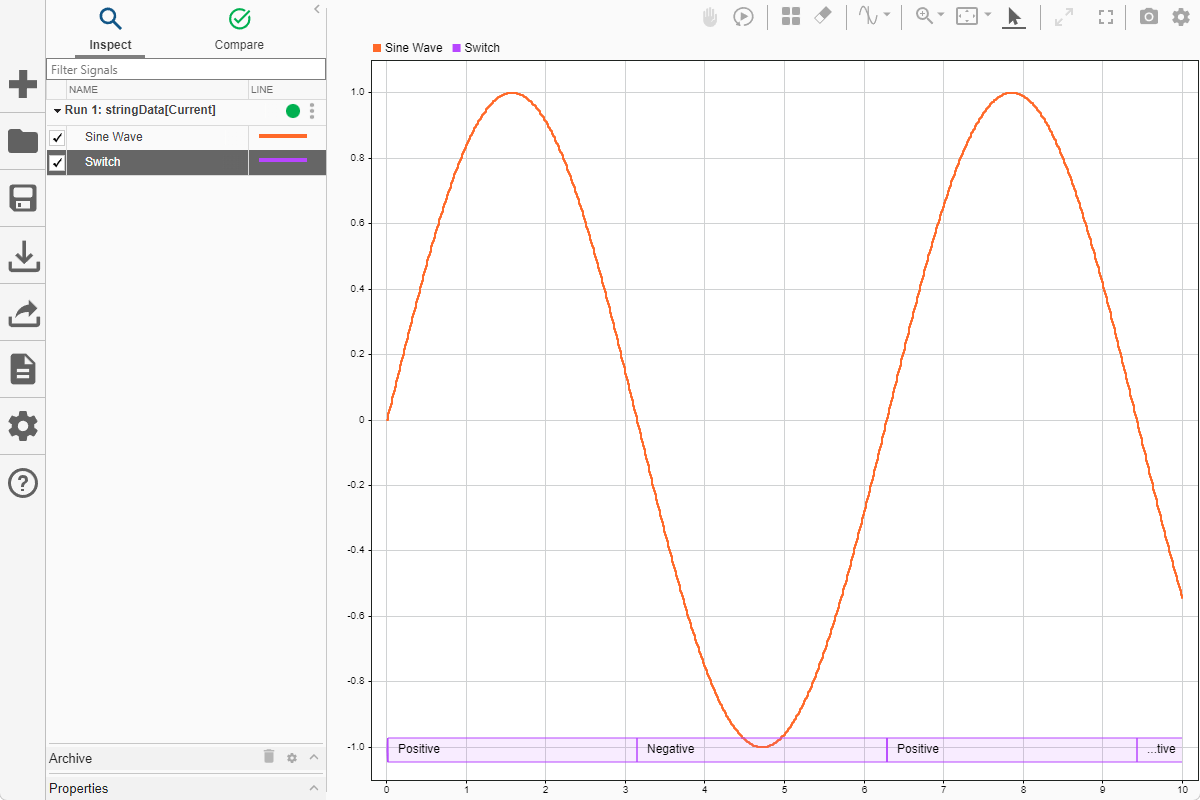
Select Show/hide data cursors ![]() to inspect how the string signal values correspond with the sine signal's values.
to inspect how the string signal values correspond with the sine signal's values.

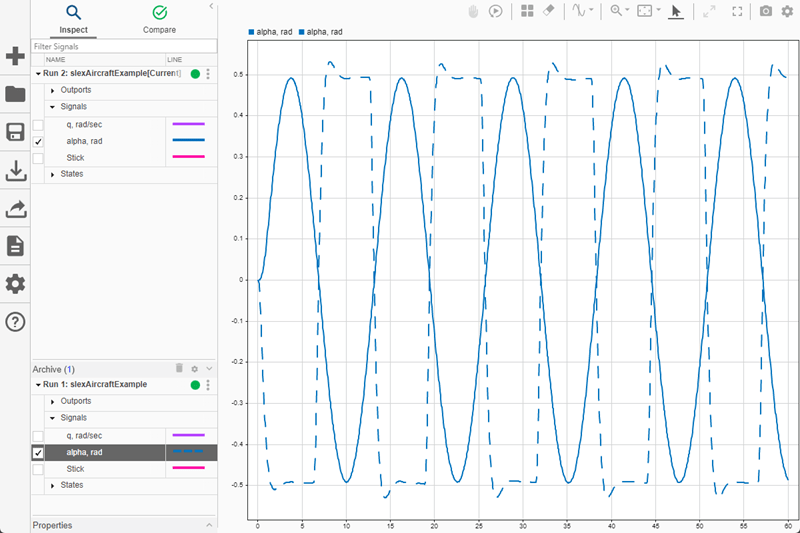
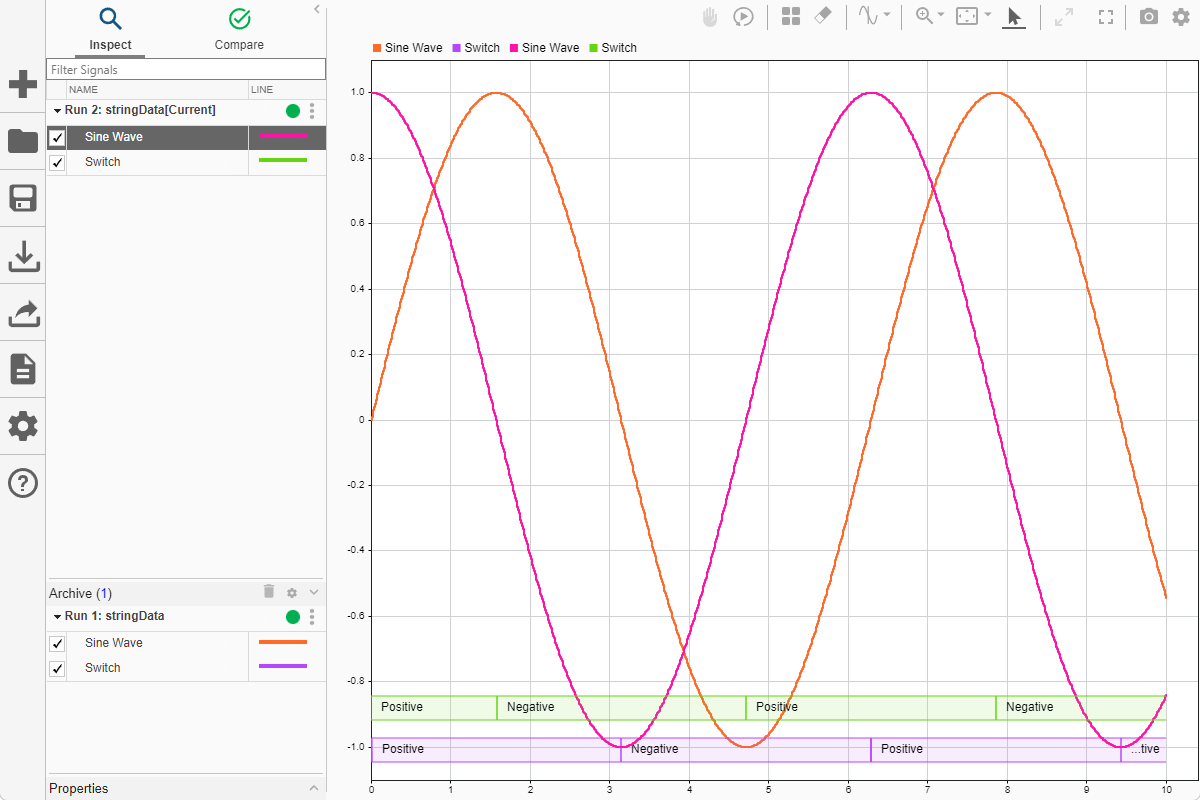
When you plot multiple string signals on a plot, the signals stack in the order they were simulated or imported, with the most recent signal positioned at the top. For example, change the phase of the sine wave controlling the switch. Then, simulate the model again. In the Simulation Data Inspector, select all of the signals from both runs to visualize both simulation results on one plot. You can change the line color to better distinguish between the two runs. The string data from the second run is stacked on top of the string data from the first run.
View Multidimensional Data
You can view and analyze multidimensional signal data in the Simulation Data Inspector. To view a signal with multidimensional signal values, use the array plot. The model MultiDim contains six Sine Wave blocks, each vertically displaced from the previous sine wave by one, connected to a Mux block. Output from the Mux block is logged to the Simulation Data Inspector using an Outport block.
Simulate the model. Then, open the Simulation Data Inspector.
mdl = "MultiDim";
sim(mdl);
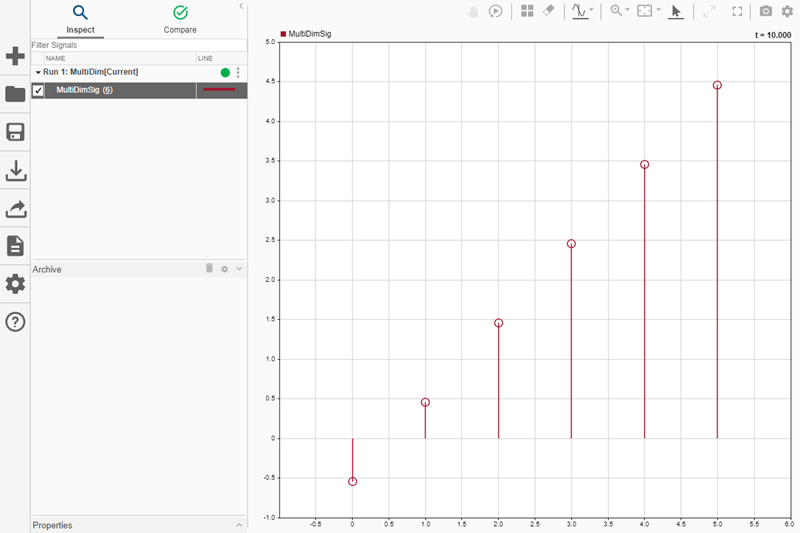
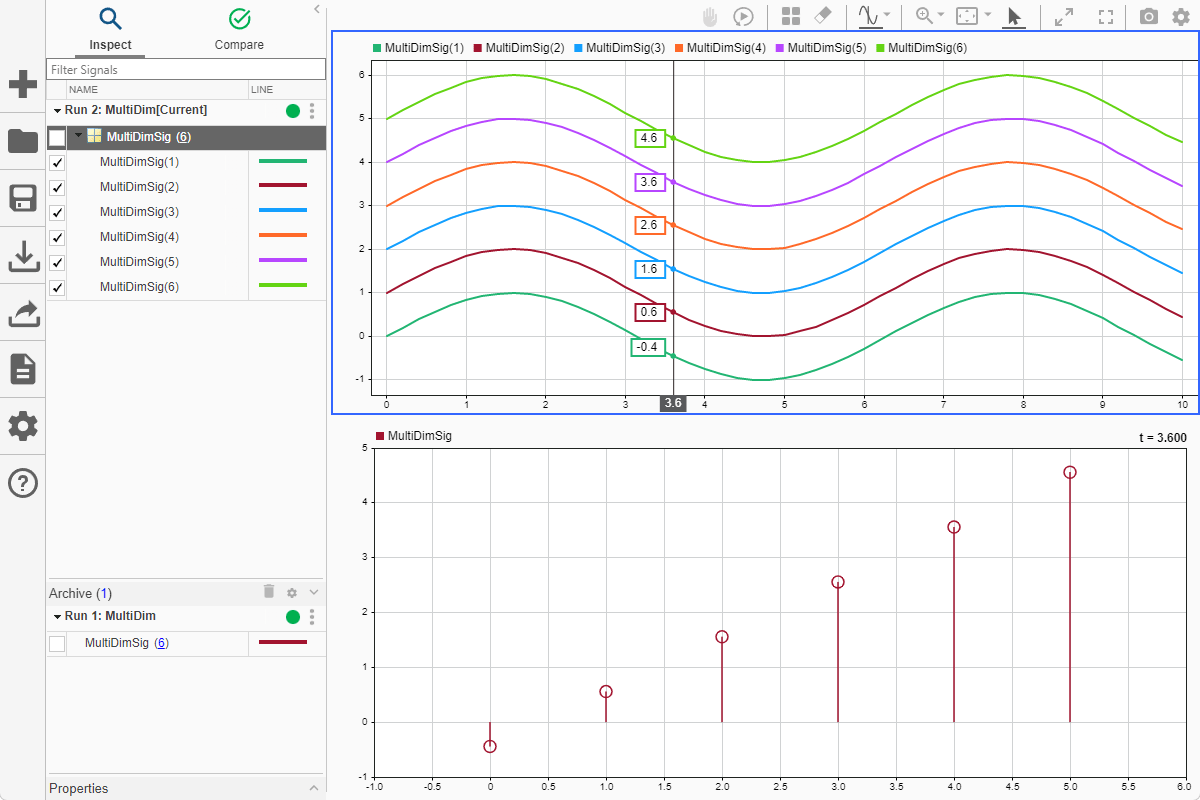
Simulink.sdi.viewTo plot data on an array plot, click Visualizations and layouts ![]() . Then, select Array. When you plot a signal with multidimensional sample values on an array plot, a stem plot displays the value of each sample at a given time. The time is shown in the upper right corner of the plot. The dimensions of the signal are displayed in parentheses next to the signal name. For example, because the multidimensional signal
. Then, select Array. When you plot a signal with multidimensional sample values on an array plot, a stem plot displays the value of each sample at a given time. The time is shown in the upper right corner of the plot. The dimensions of the signal are displayed in parentheses next to the signal name. For example, because the multidimensional signal MultiDimSig contains six channels, the array plot of the data has six markers.
You can also convert the representation of a multidimensional signal from a single signal with multidimensional sample values to a set of signals with scalar sample values called channels. Once converted to channels, you can plot the data using time plots, XY plots, maps, or sparklines. To see the difference between plotting the multidimensional signal on an array plot, and plotting the individual channels in a time plot, run the simulation again.
sim(mdl);
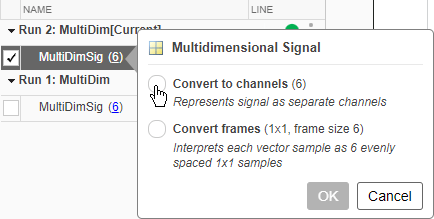
To convert the multidimensional signal in the second run to channels, click the dimensions of the signal, shown in parenthesis, next to the signal name in the Simulation Data Inspector. Then, select Convert to channels.
In the Visualizations and layouts ![]() menu, select a
menu, select a 2x1 layout. In the lower subplot, plot the signal with multidimensional sample values from the first run in an array plot. In the upper subplot, plot the channels from the second run in a time plot. To view the values of each channel at a particular time, add a cursor to the time plot. To add one cursor to the subplot, click the arrow next to Show/hide data cursors ![]() . Then, choose One cursor.
. Then, choose One cursor.
Notice that the sample values in the array plot change as you drag the cursor. As you move the cursor through time, the display of each sample value in the array plot changes to show the value of that element at that particular time. In this case, because both runs contain the same data, the values in the array plot match the values displayed by the cursor for each corresponding channel in the time plot. For example, when the cursor is positioned at 3.6 seconds, the time displayed in the upper-right corner of the array plot is also 3.6 and the value of the first sample in the array plot is equal to the value displayed by the cursor for the MultiDimSig(1) signal in the time plot.
You can also see the values in the array plot change over time by replaying the data. Click Show/hide replay controls ![]() . Then, click Replay
. Then, click Replay ![]() .
.
For more information about inspecting and analyzing multidimensional signal data, including frame-based data, see Analyze Multidimensional Signal Data.
View Frame-Based Data
Some applications buffer several samples of a signal into a frame to process with a single computation instead of processing each sample in the frame separately. When you work with frame-based signals, you can analyze the data frame by frame, or you can remove the buffering and analyze the signal without the frames.
Processing data in frames rather than point by point provides a performance boost needed in some applications. When you log frame-based signals as sample-based, you can convert the frames in the Simulation Data Inspector after simulation. For more information about viewing frame-based data in the Simulation Data Inspector, see View Multidimensional Signals Using the Array Plot.
View Event-Based Data
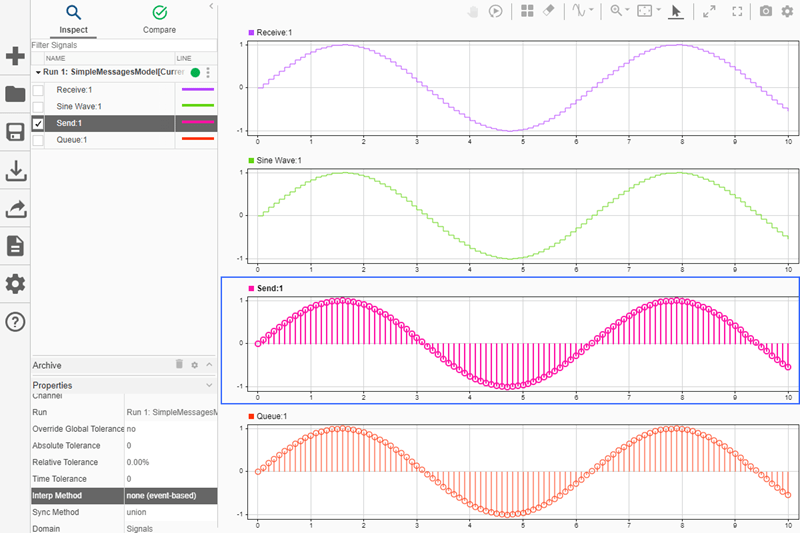
You can log or import event data to the Simulation Data Inspector. In this example, the model SimpleMessagesModel logs signal data and message data using signal logging. For more information about the model, see Animate and Understand Sending and Receiving Messages.
mdl = "SimpleMessagesModel";
open_system(mdl)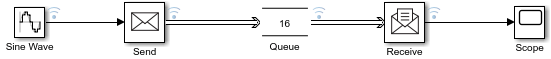
Simulate the model. During simulation:
The Sine Wave block generates the sine wave signal.
Every
0.1seconds, the Send block converts the value of the sine wave signal to a message and sends it to the Queue block.The Queue block sends messages to the Receive block.
The Receive block generates the reconstructed sine wave signal.
out = sim(mdl);
Plot the data in the Simulation Data Inspector. The Simulation Data Inspector displays message data as a stem plot, where the value for the stem is the sample of the sine wave that was taken as the message payload for the given simulation time.
Simulink.sdi.plot(out);