Main Content

sbiotrellis

R2026b

Plot data or simulation results in trellis plot

Description

trellisplot = sbiotrellis(data,groupCol,xCol,yCol) plots each group in data as defined by the group column variable groupCol into its own subplot. The data defined by column xCol is plotted against the data defined by column(s) yCol.

example

trellisplot = sbiotrellis(data,groupCol,xCol,yCol,Name=Value) uses additional options specified by one or more name-value arguments that are supported by the plot command.

example

trellisplot = sbiotrellis(data,fcnHandle,groupCol,xCol,yCol) plots each group in data as defined by the group column variable groupCol into its own subplot. sbiotrellis creates the subplot by calling the function handle, fcnHandle, with input arguments defined by the data columns xCol and yCol. The fcnHandle cannot be empty and must be specified.

The fcnHandle must have the signature fcnHandle(x,y), where x is a numeric column vector, and y is a matrix with the same number of rows as x.

For instance, if you want to create a trellis plot with a logarithmic y-axis, use @semilogy as the function handle, where semilogy is the function that plots data with logarithmic scale for the y-axis.

example

trellisplot = sbiotrellis(simData,fcnHandle,xCol,yCol) plots each group in simData into its own subplot. sbiotrellis creates the subplot by calling the function handle, fcnHandle with input arguments defined by the columns xCol and yCol. The fcnHandle can be empty ('' or []). If empty, a default time plot is created by plotting the simulation time against the states specified in yCol.

The fcnHandle must have the signature fcnHandle(simDataI,xCol,yCol), where simDataI is a single SimData object, and xCol and yCol are the corresponding input arguments to sbiotrellis.

example

trellisplot = sbiotrellis(simDataArray1,simDataArray2,fcnHandle,y1,y2) plots each element pair from simDataArray1 and simDataArray2 into its own subplot. sbiotrellis creates each subplot by calling the function handle, fcnHandle, with one element from each SimData array and the text arguments y1 and y2. Both SimData arrays must have the same number of elements. The fcnHandle cannot be empty and must be specified.

The fcnHandle must have the signature fcnHandle(simData1I,simData2I,y1,y2), where simData1I and simData2I are individual SimData objects from simDataArray1 and simDataArray2, and y1 and y2 are the corresponding input arguments to sbiotrellis.

Tip

Use the plot method of a sbiotrellis object to overlay a SimData object or a dataset on an existing sbiotrellis plot. For example, plot(trellisplot,...) adds a plot to the object trellisplot. The SimData or dataset that is being plotted must have the same number of elements or groups as the trellisplot object. The plot method has the same input arguments as sbiotrellis.

example

Examples

collapse all

Load a sample dataset. The data contains measurements of drug concentration in the central and peripheral compartments for 30 subjects.

load('sd5_302RAgeSex.mat');

Create a trellis plot of the Central concentrations for each subject.

t = sbiotrellis(data, 'ID', 'Time', 'CentralConc',...
               'Marker', 'o','LineStyle','--','MarkerFaceColor','b');
% Resize the figure.
t.hFig.Position(:) = [100 100 1200 800];
t.YLabel = "Concentration (milligram/liter)";
t.XLabel = "Time (hours)";
t.Title  = "Drug Concentration Measurements";
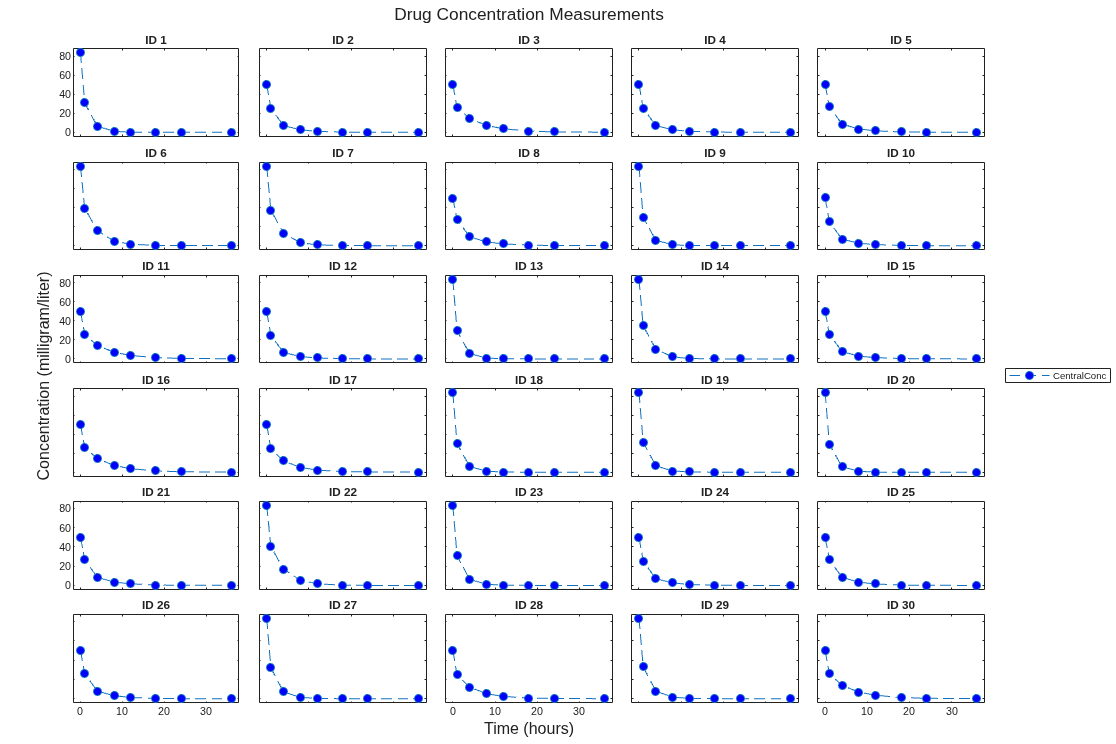
Figure contains 30 axes objects. Axes object 1 with title ID 1 contains an object of type line. Axes object 2 with title ID 2 contains an object of type line. Axes object 3 with title ID 3 contains an object of type line. Axes object 4 with title ID 4 contains an object of type line. Axes object 5 with title ID 5 contains an object of type line. Axes object 6 with title ID 6 contains an object of type line. Axes object 7 with title ID 7 contains an object of type line. Axes object 8 with title ID 8 contains an object of type line. Axes object 9 with title ID 9 contains an object of type line. Axes object 10 with title ID 10 contains an object of type line. Axes object 11 with title ID 11 contains an object of type line. Axes object 12 with title ID 12 contains an object of type line. Axes object 13 with title ID 13 contains an object of type line. Axes object 14 with title ID 14 contains an object of type line. Axes object 15 with title ID 15 contains an object of type line. Axes object 16 with title ID 16 contains an object of type line. Axes object 17 with title ID 17 contains an object of type line. Axes object 18 with title ID 18 contains an object of type line. Axes object 19 with title ID 19 contains an object of type line. Axes object 20 with title ID 20 contains an object of type line. Axes object 21 with title ID 21 contains an object of type line. Axes object 22 with title ID 22 contains an object of type line. Axes object 23 with title ID 23 contains an object of type line. Axes object 24 with title ID 24 contains an object of type line. Axes object 25 with title ID 25 contains an object of type line. Axes object 26 with title ID 26 contains an object of type line. Axes object 27 with title ID 27 contains an object of type line. Axes object 28 with title ID 28 contains an object of type line. Axes object 29 with title ID 29 contains an object of type line. Axes object 30 with title ID 30 contains an object of type line. This object represents CentralConc.

Use the plot method of the sbiotrellis object to overlay the peripheral concentration data on the same plot.

plot(t,data,'ID','Time','PeripheralConc','Marker','d',...
            'LineStyle',':','MarkerFaceColor','r');
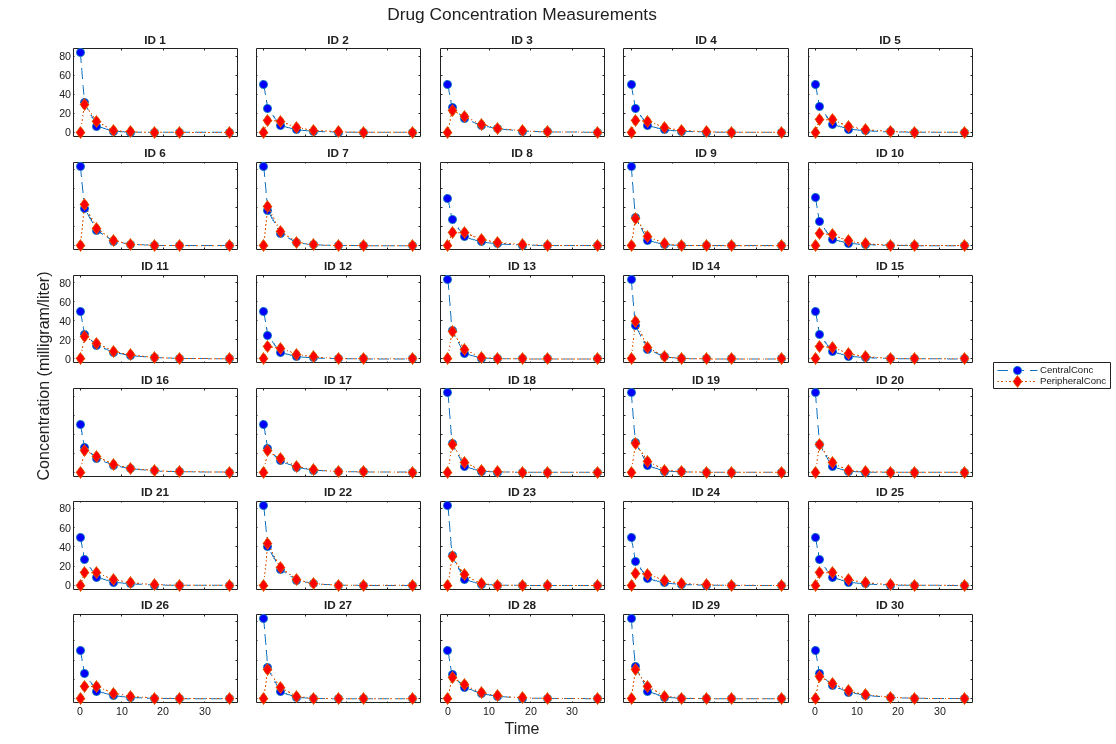
Figure contains 30 axes objects. Axes object 1 with title ID 1 contains 2 objects of type line. Axes object 2 with title ID 2 contains 2 objects of type line. Axes object 3 with title ID 3 contains 2 objects of type line. Axes object 4 with title ID 4 contains 2 objects of type line. Axes object 5 with title ID 5 contains 2 objects of type line. Axes object 6 with title ID 6 contains 2 objects of type line. Axes object 7 with title ID 7 contains 2 objects of type line. Axes object 8 with title ID 8 contains 2 objects of type line. Axes object 9 with title ID 9 contains 2 objects of type line. Axes object 10 with title ID 10 contains 2 objects of type line. Axes object 11 with title ID 11 contains 2 objects of type line. Axes object 12 with title ID 12 contains 2 objects of type line. Axes object 13 with title ID 13 contains 2 objects of type line. Axes object 14 with title ID 14 contains 2 objects of type line. Axes object 15 with title ID 15 contains 2 objects of type line. Axes object 16 with title ID 16 contains 2 objects of type line. Axes object 17 with title ID 17 contains 2 objects of type line. Axes object 18 with title ID 18 contains 2 objects of type line. Axes object 19 with title ID 19 contains 2 objects of type line. Axes object 20 with title ID 20 contains 2 objects of type line. Axes object 21 with title ID 21 contains 2 objects of type line. Axes object 22 with title ID 22 contains 2 objects of type line. Axes object 23 with title ID 23 contains 2 objects of type line. Axes object 24 with title ID 24 contains 2 objects of type line. Axes object 25 with title ID 25 contains 2 objects of type line. Axes object 26 with title ID 26 contains 2 objects of type line. Axes object 27 with title ID 27 contains 2 objects of type line. Axes object 28 with title ID 28 contains 2 objects of type line. Axes object 29 with title ID 29 contains 2 objects of type line. Axes object 30 with title ID 30 contains 2 objects of type line. These objects represent CentralConc, PeripheralConc.

Specify the function handle @semilogy to change the y-axis to log scale.

t2 = sbiotrellis(data,@semilogy,'ID','Time','CentralConc');
%Resize the figure
t2.hFig.Position(:) = [100 100 1200 800];
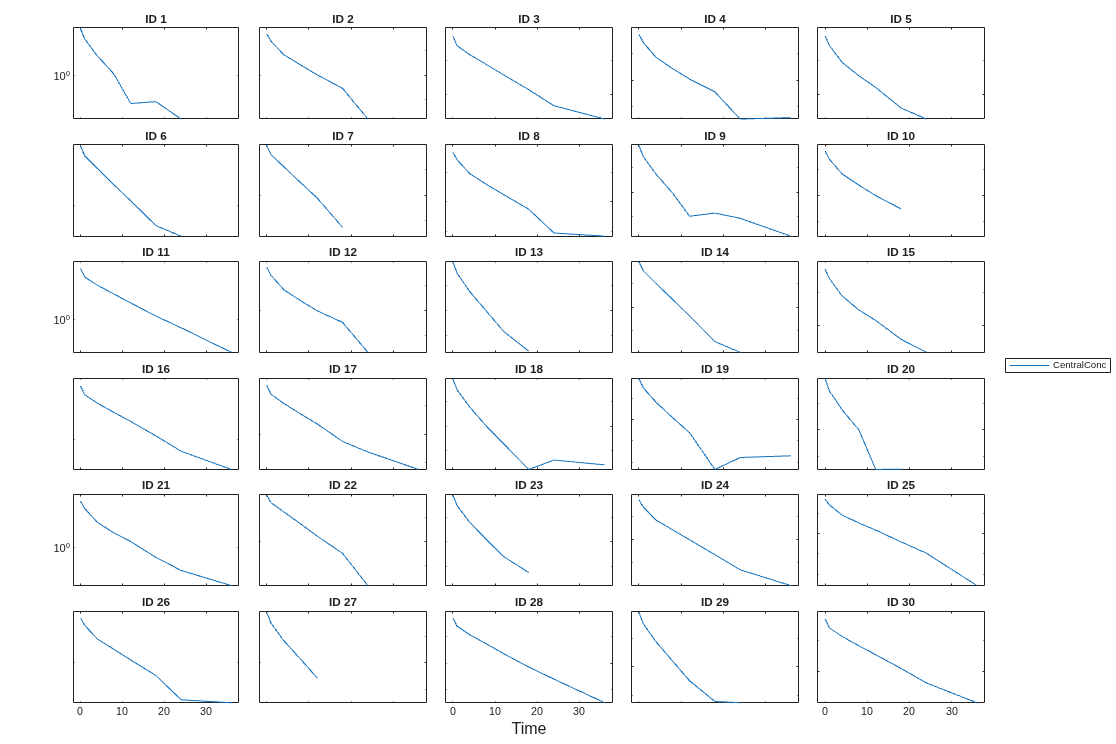
Figure contains 30 axes objects. Axes object 1 with title ID 1 contains an object of type line. Axes object 2 with title ID 2 contains an object of type line. Axes object 3 with title ID 3 contains an object of type line. Axes object 4 with title ID 4 contains an object of type line. Axes object 5 with title ID 5 contains an object of type line. Axes object 6 with title ID 6 contains an object of type line. Axes object 7 with title ID 7 contains an object of type line. Axes object 8 with title ID 8 contains an object of type line. Axes object 9 with title ID 9 contains an object of type line. Axes object 10 with title ID 10 contains an object of type line. Axes object 11 with title ID 11 contains an object of type line. Axes object 12 with title ID 12 contains an object of type line. Axes object 13 with title ID 13 contains an object of type line. Axes object 14 with title ID 14 contains an object of type line. Axes object 15 with title ID 15 contains an object of type line. Axes object 16 with title ID 16 contains an object of type line. Axes object 17 with title ID 17 contains an object of type line. Axes object 18 with title ID 18 contains an object of type line. Axes object 19 with title ID 19 contains an object of type line. Axes object 20 with title ID 20 contains an object of type line. Axes object 21 with title ID 21 contains an object of type line. Axes object 22 with title ID 22 contains an object of type line. Axes object 23 with title ID 23 contains an object of type line. Axes object 24 with title ID 24 contains an object of type line. Axes object 25 with title ID 25 contains an object of type line. Axes object 26 with title ID 26 contains an object of type line. Axes object 27 with title ID 27 contains an object of type line. Axes object 28 with title ID 28 contains an object of type line. Axes object 29 with title ID 29 contains an object of type line. Axes object 30 with title ID 30 contains an object of type line. This object represents CentralConc.

plot(t2,data,@semilogy,'ID','Time','PeripheralConc');
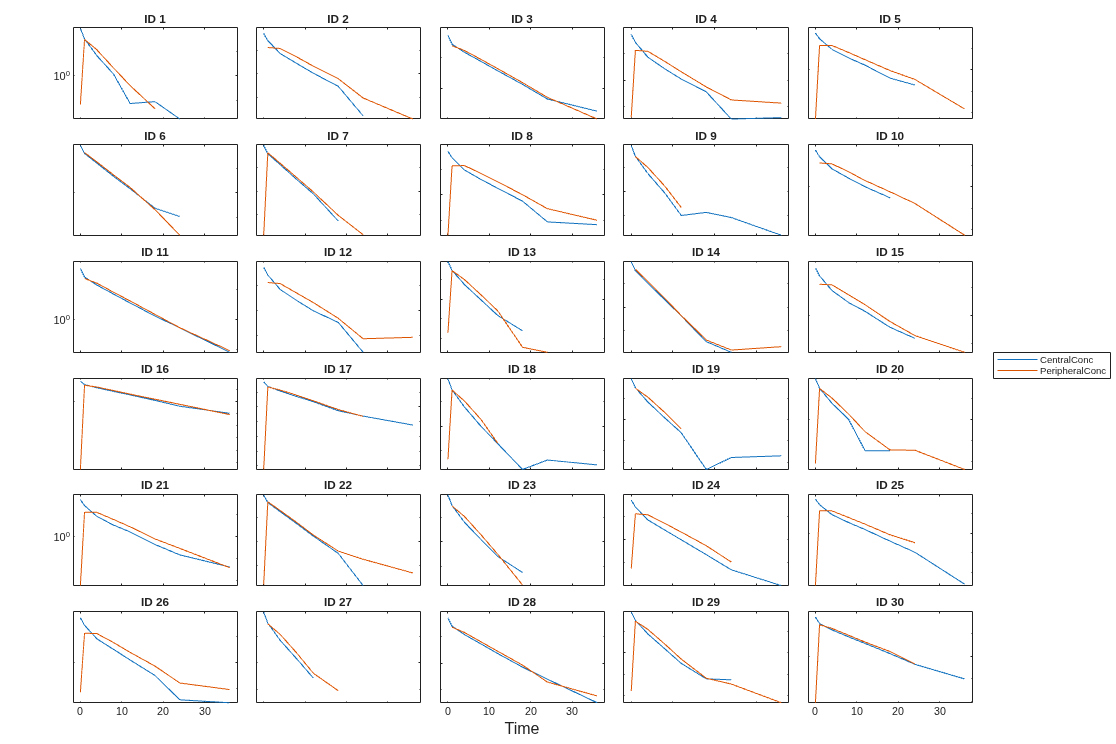
Figure contains 30 axes objects. Axes object 1 with title ID 1 contains 2 objects of type line. Axes object 2 with title ID 2 contains 2 objects of type line. Axes object 3 with title ID 3 contains 2 objects of type line. Axes object 4 with title ID 4 contains 2 objects of type line. Axes object 5 with title ID 5 contains 2 objects of type line. Axes object 6 with title ID 6 contains 2 objects of type line. Axes object 7 with title ID 7 contains 2 objects of type line. Axes object 8 with title ID 8 contains 2 objects of type line. Axes object 9 with title ID 9 contains 2 objects of type line. Axes object 10 with title ID 10 contains 2 objects of type line. Axes object 11 with title ID 11 contains 2 objects of type line. Axes object 12 with title ID 12 contains 2 objects of type line. Axes object 13 with title ID 13 contains 2 objects of type line. Axes object 14 with title ID 14 contains 2 objects of type line. Axes object 15 with title ID 15 contains 2 objects of type line. Axes object 16 with title ID 16 contains 2 objects of type line. Axes object 17 with title ID 17 contains 2 objects of type line. Axes object 18 with title ID 18 contains 2 objects of type line. Axes object 19 with title ID 19 contains 2 objects of type line. Axes object 20 with title ID 20 contains 2 objects of type line. Axes object 21 with title ID 21 contains 2 objects of type line. Axes object 22 with title ID 22 contains 2 objects of type line. Axes object 23 with title ID 23 contains 2 objects of type line. Axes object 24 with title ID 24 contains 2 objects of type line. Axes object 25 with title ID 25 contains 2 objects of type line. Axes object 26 with title ID 26 contains 2 objects of type line. Axes object 27 with title ID 27 contains 2 objects of type line. Axes object 28 with title ID 28 contains 2 objects of type line. Axes object 29 with title ID 29 contains 2 objects of type line. Axes object 30 with title ID 30 contains 2 objects of type line. These objects represent CentralConc, PeripheralConc.

Compare simulation results from two dosing regimens by plotting them side by side using sbiotrellis with SimData arrays.

Create a simple one-compartment model with first-order elimination.

model = sbiomodel("OneCptPK");
comp = addcompartment(model,"Central",1,CapacityUnits="liter");
addspecies(comp,"Drug",0,InitialAmountUnits="milligram");
addparameter(model,"ke",ValueUnits="1/hour");
rxn = addreaction(model,"Central.Drug -> null");
kl = addkineticlaw(rxn,"MassAction");
kl.ParameterVariableNames = "ke";

Set the simulation stop time to 24 hours and define two bolus doses at different amounts.

cs = getconfigset(model,"active");
cs.StopTime = 24;
cs.TimeUnits = "hour";
doseHigh = sbiodose("HighDose",Amount=100,AmountUnits="milligram",TargetName="Central.Drug");
doseLow = sbiodose("LowDose",Amount=25,AmountUnits="milligram",TargetName="Central.Drug");

Simulate four subjects with different elimination rates under the high-dose regimen.

keValues = [0.05 0.1 0.15 0.2];
for i = numel(keValues):-1:1
    model.Parameters(1).Value = keValues(i);
    sdHigh(i,1) = sbiosimulate(model,doseHigh);
end

Use sbiotrellis with a single SimData array and a function handle to create a trellis plot with filled area curves. The function handle receives one SimData element per panel along with the column name arguments xCol and yCol.

trellisplot = sbiotrellis(sdHigh,@areaPlot,"Time","Drug");
trellisplot.Title = "High Dose (100 mg) - Area Plot";
trellisplot.XLabel = "Time (hours)";
trellisplot.YLabel = "Drug Concentration (mg/L)";
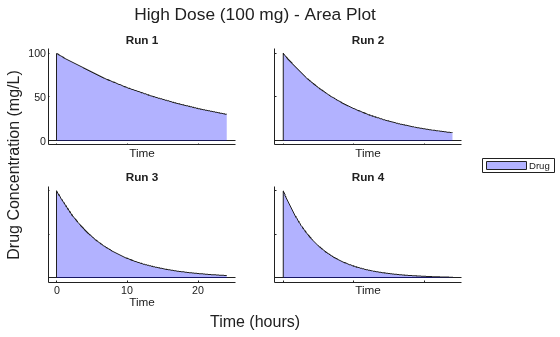
Figure contains 4 axes objects. Axes object 1 with title Run 1, xlabel Time contains an object of type area. This object represents Drug. Axes object 2 with title Run 2, xlabel Time contains an object of type area. This object represents Drug. Axes object 3 with title Run 3, xlabel Time contains an object of type area. This object represents Drug. Axes object 4 with title Run 4, xlabel Time contains an object of type area. This object represents Drug.

Now simulate the same four subjects under the low-dose regimen and compare both sets of results using sbiotrellis with two SimData arrays.

for i = numel(keValues):-1:1
    model.Parameters(1).Value = keValues(i);
    sdLow(i,1) = sbiosimulate(model,doseLow);
end

Use sbiotrellis with two SimData arrays and a custom function handle to overlay results from both doses in each panel. The function handle receives one element from each array per panel and plots them together.

trellisplot2 = sbiotrellis(sdHigh,sdLow,@compareDoses,"Drug","Drug");
trellisplot2.Title = "High Dose (100 mg) vs Low Dose (25 mg)";
trellisplot2.XLabel = "Time (hours)";
trellisplot2.YLabel = "Drug Concentration (mg/L)";
trellisplot2.updateLegend(["High Dose","Low Dose"]);
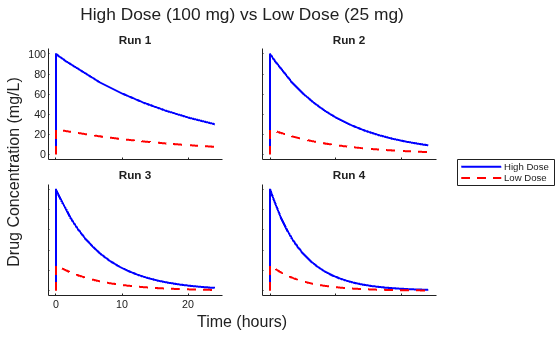
Figure contains 4 axes objects. Axes object 1 with title Run 1 contains 2 objects of type line. Axes object 2 with title Run 2 contains 2 objects of type line. Axes object 3 with title Run 3 contains 2 objects of type line. Axes object 4 with title Run 4 contains 2 objects of type line. These objects represent High Dose, Low Dose.

Each panel corresponds to one subject. The blue solid line shows the high-dose response and the red dashed line shows the low-dose response.

The function handle areaPlot is defined as a local function. It receives a single SimData object and the column name arguments xCol and yCol. It uses selectbyname to extract the data for yCol, displays it as a filled area curve, and uses xCol to label the x-axis.

The function handle compareDoses is defined as a local function. It receives one SimData object from each array and the text arguments y1 and y2, which in this case are both "Drug" — the name of the species to extract from each SimData object. It uses selectbyname to extract the time and data vectors, then overlays both results on the same axes.

function areaPlot(sdI,xCol,yCol)
    [t,d] = selectbyname(sdI,yCol);
    area(t,d,FaceAlpha=0.3,FaceColor="b",DisplayName=string(yCol));
    xlabel(xCol)
end

function compareDoses(sd1i,sd2i,y1,y2)
    [t1,d1] = selectbyname(sd1i,y1);
    [t2,d2] = selectbyname(sd2i,y2);
    plot(t1,d1,"b-",LineWidth=1.5);
    hold on
    plot(t2,d2,"r--",LineWidth=1.5);
    hold off
end

Input Arguments

collapse all

Data, specified as a dataset containing grouped data, a groupedData object, or a table.

Group column name, specified as a character vector or string which is the name of a column in data that contains grouping information or an empty name '' or ""which implies there is only one group in data.

Name of a column to plot on the x-axis, specified as a character vector or string.

If data is groupedData, then xCol can also be an empty name '' or "", and the x-coordinates of the data are determined by the variable specified in DATA.Properties.IndependentVariableName.

If data is dataset or table, then xCol cannot be empty.

Name of a column to plot on the y-axis, specified as a character vector, string, string vector, or cell array of character vectors.

Handle to a function, specified as a function handle.

If the first argument is a dataset or groupedData object, the fcnHandle must have the signature fcnHandle(x,y), where x is a numeric column vector, and y is a matrix with the same number of rows as x.

If it is a SimData object, the fcnHandle must have the signature fcnHandle(simDataI,xCol,yCol), where simDataI is a single SimData object, and xCol and yCol are the corresponding input arguments to sbiotrellis.

If the first two arguments are SimData arrays, the fcnHandle must have the signature fcnHandle(simData1I,simData2I,y1,y2), where simData1I and simData2I are individual SimData objects from simDataArray1 and simDataArray2, and y1 and y2 are the corresponding input arguments to sbiotrellis.

Simulation data, specified as a SimData object.

First simulation data array, specified as a SimData object array. simDataArray1 must have the same number of elements as simDataArray2.

Second simulation data array, specified as a SimData object array. simDataArray2 must have the same number of elements as simDataArray1.

Text argument passed to the function handle for the first SimData array, specified as a character vector, string scalar, string vector, or cell array of character vectors. The interpretation of y1 is determined by fcnHandle.

Text argument passed to the function handle for the second SimData array, specified as a character vector, string scalar, string vector, or cell array of character vectors. The interpretation of y2 is determined by fcnHandle.

Output Arguments

collapse all

Plot object, specified as a sbiotrellis object. The object has the following properties.

  • hFig – This is a MATLAB® figure object. Use this object to control the appearance and behavior of the figure. For instance, to change the figure window background color to white, enter trellisplot.hFig.Color = 'white'. For the list of properties, see the Figure properties.

  • nPlots – This property tells you the total number of plots in the figure.

  • plots – This is a vector of axes objects with length equal to nPlots. Use this property to control the appearance and behavior of axes objects. For example, if you want to change the y-axis to a log scale, enter set(trellisplot.plots,'YScale','log'). For the list of properties, see the Axes Properties properties.

  • XLabel – X-axis label, specified as a character vector or string.

  • YLabel – Y-axis label, specified as a character vector or string.

  • Title – Plot title, specified as a character vector or string.

Version History

Introduced in R2009a

expand all