plot
Visualize gain and phase uncertainty of a umargin
block
Syntax
Description
plot( generates a two-axis plot
visualizing the gain and phase uncertainty modeled by a ublk)umargin block. The
plot shows:
The ranges of modeled gain and phase uncertainty. The plot shows the maximum gain-only variation, the maximum phase-only variation, and a shaded region containing the simultaneous gain and phase variations represented by
ublk.The disk of values taken by the dynamic, multiplicative factor F(s) that models the gain and phase uncertainty. For SISO loops, this factor changes the open-loop response L to L*F. For more information about the disk model of uncertainty, see Stability Analysis Using Disk Margins.
Examples
Create a umargin block that models gain that can decrease by 10% but increase by 60% in the absence of phase variation, and a phase variation of ±15° in the absence of gain variation.
DGM = getDGM([0.9,1.6],[-15,15],'tight');
F = umargin('F',DGM)
Uncertain gain/phase "F" with relative gain change in [0.86,1.6] and phase change of ±15 degrees.
Block Properties
Visualize the corresponding uncertainty disk and the ranges of gain and phase variations modeled by F.
plot(F)
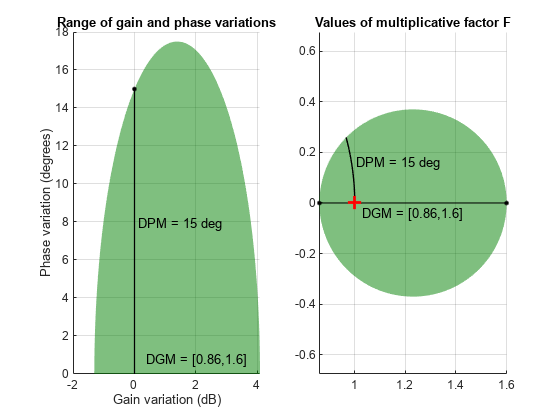
The left-hand plot shows:
The range of modeled gain variations, in the absence of phase variation. This range is shown along the x-axis, given by
DGM= [0.86 1.6], or about –1.3 dB to 4 dB.The range of modeled phase variations in the absence of gain variations. This value is shown along the y-axis where the gain variation is 0 dB, or ±15°.
A shaded region that shows the simultaneous gain and phase variations included in the model. For instance, if the gain increases by about 1 dB, the phase can vary by as much as about ±17°.
The right-hand plot shows the disk of relative change in the open-loop response L. The umargin block models gain and phase uncertainty as an arbitrary multiplicative factor F(s) whose Nyquist curve lies entirely within this disk. The gain and phase uncertainty perturbs the open-loop response L(s) to L(s)F(s). For more details about this uncertainty model, see umargin and Stability Analysis Using Disk Margins.
Input Arguments
Version History
Introduced in R2020a