Main Content

plot

R2026b

Plot RoadRunner HD Map

Since R2022b

    Description

    plot(rrMap) plots the RoadRunner HD Map's lane centers, lane boundaries, lane group centers, and barriers.

    example

    plot(rrMap,Name=Value) specifies additional name-value pair arguments for the HD map.

    axesHandle = plot(___) returns a figure handle as an axes (MATLAB) object.

    Examples

    collapse all

    Create an empty RoadRunner HD Map by calling the roadrunnerHDMap object.

    rrMap = roadrunnerHDMap;

    Specify the name of the binary file you want to read. Use the read function to read the file specified by the argument filename.

    filename = "C:\RR\MyProject\Scenes\MyMap.rrhd";
    read(rrMap,filename)
    rrMap
    rrMap = 
      roadrunnerHDMap with properties:
    
                     Author: ""
               GeoReference: [0 0]
         GeographicBoundary: [2×3 double]
                      Lanes: [728×1 roadrunner.hdmap.Lane]
                SpeedLimits: [356×1 roadrunner.hdmap.SpeedLimit]
             LaneBoundaries: [908×1 roadrunner.hdmap.LaneBoundary]
                 LaneGroups: [163×1 roadrunner.hdmap.LaneGroup]
               LaneMarkings: [4×1 roadrunner.hdmap.LaneMarking]
                  Junctions: [11×1 roadrunner.hdmap.Junction]
               BarrierTypes: [0×1 roadrunner.hdmap.BarrierType]
                   Barriers: [0×1 roadrunner.hdmap.Barrier]
                  SignTypes: [2×1 roadrunner.hdmap.SignType]
                      Signs: [4×1 roadrunner.hdmap.Sign]
          StaticObjectTypes: [5×1 roadrunner.hdmap.StaticObjectType]
              StaticObjects: [443×1 roadrunner.hdmap.StaticObject]
        StencilMarkingTypes: [2×1 roadrunner.hdmap.StencilMarkingType]
            StencilMarkings: [10×1 roadrunner.hdmap.StencilMarking]
          CurveMarkingTypes: [1×1 roadrunner.hdmap.CurveMarkingType]
              CurveMarkings: [10×1 roadrunner.hdmap.CurveMarking]
                SignalTypes: [2×1 roadrunner.hdmap.SignalType]
                    Signals: [10×1 roadrunner.hdmap.Signal]
               ParkingEdges: [0×1 roadrunner.hdmap.ParkingEdge]
              ParkingSpaces: [0×1 roadrunner.hdmap.ParkingSpace]


    Plot the map.

    plot(rrMap)
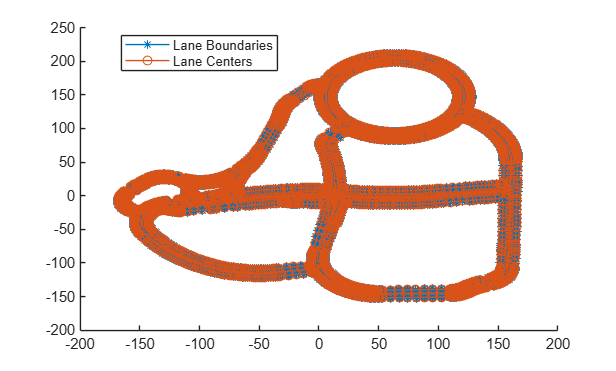
    Figure contains an axes object. The axes object contains 2 objects of type line. These objects represent Lane Boundaries, Lane Centers.

    Input Arguments

    collapse all

    RoadRunner HD Map road data model, specified as a roadrunnerHDMap object. rrMap defines a simple data structure to represent road layouts using lanes, lane boundaries, lane markings, and junctions. This object provides functions that support reading, writing, and plotting HD map data.

    Name-Value Arguments

    collapse all

    Specify optional pairs of arguments as Name1=Value1,...,NameN=ValueN, where Name is the argument name and Value is the corresponding value. Name-value arguments must appear after other arguments, but the order of the pairs does not matter.

    Example:

    Handle to an axes object, specified as a handle object to contain the plot. If this property is not specified, the plot function generates a new figure.

    Display lane group centers in the plot, specified as logical 0 (false) or logical 1 (true). If you set ShowLaneGroups to true, then the plot function displays the lane group centers in the plot.

    Display barrier centers in the plot, specified as logical 0 (false) or logical 1 (true). If you set ShowBarriers to true, then the plot function displays the barrier centers in the plot.

    Display signs in the plot, specified as logical 0 (false) or logical 1 (true). If you set ShowSigns to true, then the plot function displays the signs in the plot.

    Display static objects in the plot, specified as logical 0 (false) or logical 1 (true). If you set ShowStaticObjects to true, then the plot function displays the static objects in the plot.

    Display legend in the plot, specified as logical 1 (true) or logical 0 (false). If you set ShowLegend to false, then the plot function does not displays the legend for the plot. A legend is not shown when the Parent name-value argument is specified.

    Display line markers in the plot, specified as logical 1 (true) or logical 0 (false). If you set ShowLineMarkers to true, then the plot function displays the line markers for the plot.

    Output Arguments

    collapse all

    Figure handle, returned as an Axes (MATLAB) object.

    Version History

    Introduced in R2022b