Main Content

2-D CFAR Detector

Two-dimensional constant false alarm rate (CFAR) detector

  • 2-D CFAR Detector block

Libraries:
Phased Array System Toolbox / Detection

Description

The 2-D CFAR Detector block implements a constant false-alarm rate detector for two dimensional image data. A detection is declared when an image cell value exceeds a threshold. To maintain a constant false alarm-rate, the threshold is set to a multiple of the image noise power. The detector estimates noise power from neighboring cells surrounding the cell-under-test (CUT) using one of three cell averaging methods, or an order statistics method. The cell-averaging methods are cell-averaging (CA), greatest-of cell averaging (GOCA), or smallest-of cell averaging (SOCA).

For each test cell, the detector:

  1. estimates the noise statistic from the cell values in the training band surrounding the CUT cell.

  2. computes the threshold by multiplying the noise estimate by the threshold factor.

  3. compares the CUT cell value to the threshold to determine whether a target is present or absent. If the value is greater than the threshold, a target is present.

Ports

Input

expand all

Input image, specified as a real M-by-N matrix or real M-by-N-by-P array. M and N represent the rows and columns of the matrix. Each page is a different 2-D signal.

The size of the first dimension of the input matrix can vary to simulate a changing signal length. A size change can occur, for example, in the case of a pulse waveform with variable pulse repetition frequency.

The size of the first dimension of the input matrix can vary to simulate a changing signal length. A size change can occur, for example, in the case of a pulse waveform with variable pulse repetition frequency.

Data Types: double
Complex Number Support: Yes

Location of test cells, specified as a 2-by-L matrix of positive integers, where L is the number of test cells. Each column of idx specifies the row and column index of a CUT cell. The locations of CUT cells are restricted so that their training regions lie completely within the input images.

Data Types: double

Threshold factor used to calculate the detection threshold, specified as a positive scalar.

Dependencies

To enable this port, set the Threshold factor method parameter to 'Input port'

Data Types: double

Output

expand all

Detection results, whose format depends on the Output Format property

  • When OutputFormat is 'Cut result', Y is a D-by-P matrix containing logical detection results for cells under test. D is the length of cutidx and P is the number of pages of X. The rows of Y correspond to the rows of cutidx. For each row, Y contains 1 in a column if there is a detection in the corresponding cell in X. Otherwise, Y contains a 0.

  • When OutputFormat is Detection index, Y is a K-by-L matrix containing detections indices. K is the number of dimensions of X. L is the number of detections found in the input data. When X is a matrix, Y contains the row and column indices of each detection in X in the form [detrow;detcol]. When X is an array, Y contains the row, column, and page indices of each detection in X in the form [detrow;detcol;detpage]. When the NumDetectionsSource property is set to 'Property', L equals the value of the NumDetections property. If the number of actual detections is less than this value, columns without detections are set to NaN.

Data Types: double

Computed detection threshold for each detected cell, returned as a real-valued matrix. Th has the same dimensions as Y.

  • When OutputFormat is 'CUT result', Th returns the detection threshold whenever an element of Y is 1 and NaN whenever an element of Y is 0.

  • When OutputFormat is Detection index, th returns a detection threshold for each corresponding detection in Y. When the NumDetectionsSource property is set to 'Property', L equals the value of the NumDetections property. If the number of actual detections is less than this value, columns without detections are set to NaN.

Dependencies

To enable this port, select the Output detection threshold checkbox.

Data Types: double

Estimated noise power for each detected cell, returned as a real-valued matrix. noise has the same dimensions as Y.

  • When OutputFormat is 'CUT result', noise returns the noise power whenever an element of Y is 1 and NaN whenever an element of Y is 0.

  • When OutputFormat is 'Detection index', noise returns a noise power for each corresponding detection in Y. When the NumDetectionsSource property is set to 'Property', L equals the value of the NumDetections property. If the number of actual detections is less than this value, columns without detections are set to NaN.

Dependencies

To enable this port, select the Output estimated noise power checkbox.

Data Types: double

Parameters

expand all

Noise power estimation algorithm, specified as CA, GOCA, SOCA, or OS. For CA, GOCA, SOCA, the noise power is the sample mean derived from the training band. For OS, the noise power is the kth cell value obtained from a numerical ordering of all training cell values. Set k by the Rank of order statistic parameter. See Training cells.

Averaging MethodDescription
CA — Cell-averaging algorithm

Computes the sample mean of all training cells surrounding the CUT cell.

GOCA — Greatest-of cell-averaging algorithm

Splits the 2-D training window surrounding the CUT cell into left and right halves. Then, the algorithm computes the sample mean for each half and selects the largest mean.

SOCA — Smallest-of cell-averaging algorithm

Splits the 2-D training window surrounding the CUT cell into left and right halves. Then, the algorithm computes the sample mean for each half and selects the smallest mean.

OS — Order statistic algorithm

Sorts training cells in ascending order of numeric values. Then the algorithm selects the kth value from the list. k is the rank specified by the Rank parameter.

Specify the rank of the order statistic used in the 2-D CFAR algorithm as a positive integer. The value of this parameter must lie between 1 and Ntrain, where Ntrain is the number of training cells. A value of 1 selects the smallest value in the training region.

Dependencies

To enable this parameter, set the CFAR Algorithm parameter to OS.

The number of row and column guard cells on each side of the cell under test as nonnegative integers. The first element specifies the guard band size along the row dimension. The second element specifies the guard band size along the row dimension. Specifying Size in cells of the guard region band as a scalar is equivalent to specifying a vector with the same value for both dimensions. For example, a value of [1 1], indicates that there is a one-guard-cell-wide region surrounding each CUT cell.

Size in cells of the training region band, specified as a nonnegative integer or 1-by-2 matrix of nonnegative integers. The first element specifies the training band size along the row dimension, and the second along the column dimension. Specifying Size in cells of the training region band as a scalar is equivalent to specifying a vector with the same value for both dimensions. For example, a value of [1 1] indicates that there is a one-training-cell-wide region surrounding the guard region for each cell under test.

Method to determine threshold factor, specified as Auto, Input port, or Custom.

  • When you choose Auto, the threshold factor is determined from the estimated noise statistic and the probability of false alarm.

  • When you choose Input Port, set the threshold factor using the K input port.

  • When you choose Custom, set the threshold factor using the Custom threshold factor parameter.

Custom threshold factor, specified as a positive scalar.

Dependencies

To enable this parameter, set the Threshold factor method parameter to Custom.

Probability of false alarm, specified as a real scalar between 0 and 1. You can calculate the threshold factor from the required probability of false alarm.

Dependencies

To enable this parameter, set the Threshold factor method property to Auto.

Format of detection results, specified as CUT result or Detection index.

  • When set to 'CUT result', the detection results are logical detection values (1 or 0) for each tested cell.

  • When set to 'Detection index', the results form a vector or matrix containing the indices of tested cells that exceed a detection threshold.

Select this check box to enable the output of detection thresholds via the Th output port.

Select this check box to enable the output of estimated noise power via the N output port.

Source of the number of detections, specified as Auto or Property. When you select Auto, the number of detection indices reported is the total number of cells under test that have detections. If you select Property, the number of reported detections is determined by the value of the Maximum number of detections parameter.

Dependencies

To enable this parameter, set the Output format parameter to Detection index.

Data Types: char

Maximum number of detection indices to report, specified as a positive integer.

Dependencies

To enable this parameter, set the Output format parameter to Detection index and the Source of the number of detections parameter to Property.

Data Types: double

Algorithms

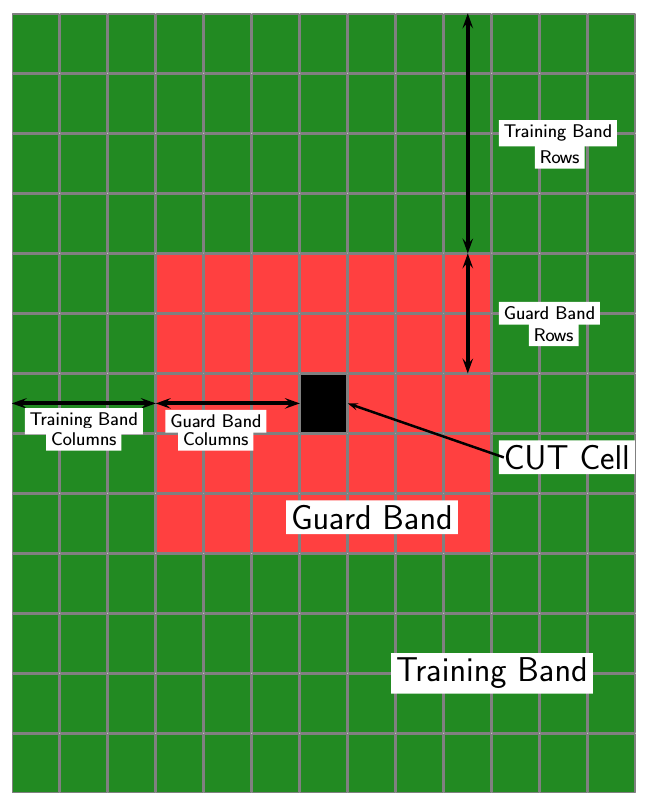
CFAR 2-D requires an estimate of the noise power. Noise power is computed from cells that are assumed not to contain any target signal. These cells are the training cells. Training cells form a band around the cell-under-test (CUT) cell but may be separated from the CUT cell by a guard band. The detection threshold is computed by multiplying the noise power by the threshold factor.

For GOCA and SOCA averaging, the noise power is derived from the mean value of one of the left or right halves of the training cell region.

Because the number of columns in the training region is odd, the cells in the middle column are assigned equally to either the left or right half.

When using the order-statistic method, the rank cannot be larger than the number of cells in the training cell region, Ntrain. You can compute Ntrain.

  • NTC is the number of training band columns.

  • NTR is the number of training band rows.

  • NGC is the number of guard band columns.

  • NGR is the number of guard band rows.

The total number of cells in the combined training region, guard region, and CUT cell is Ntotal = (2NTC + 2NGC + 1)(2NTR+ 2NGR + 1).

The total number of cells in the combined guard region and CUT cell is Nguard = (2NGC + 1)(2NGR + 1).

The number of training cells is Ntrain = Ntotal – Nguard.

By construction, the number of training cells is always even. Therefore, to implement a median filter, you can choose a rank of Ntrain/2 or Ntrain/2 + 1.

Version History

Introduced in R2016b