polygonDecomposition
Syntax
Description
polySet = polygonDecomposition(poly)
[___,
additionally specifies decomposition algorithm options, and returns any combination of
output arguments from previous syntaxes. To return a connectivity graph of the
nonoverlapping polygons from the decomposition as a field in the
solnInfo] = polygonDecomposition(poly,options)solnInfo output argument, the ReturnConnectivity
property of options must be true or
1.
Examples
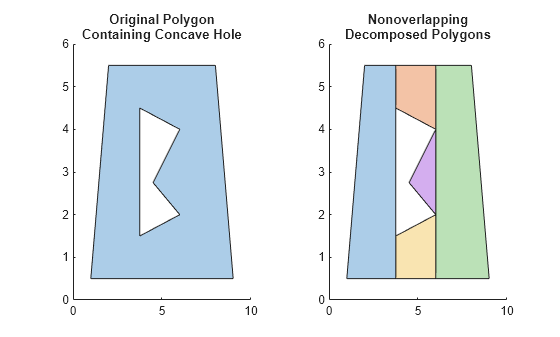
Load polygon vertices and use the vertices to create a polyshape object.
load("exampleSimplePolygonVertices.mat","verticesX","verticesY")
p = polyshape(verticesX,verticesY);
Perform polygon decomposition with the default algorithm and options.
polySet = polygonDecomposition(p);
Plot the original polygon and the decomposed polygon side by side.
tiledlayout(1,2,TileSpacing="loose")
nexttile
plot(p)
title(["Original Polygon","Containing Concave Hole"])
nexttile
plot(polySet)
title(["Nonoverlapping","Decomposed Polygons"])
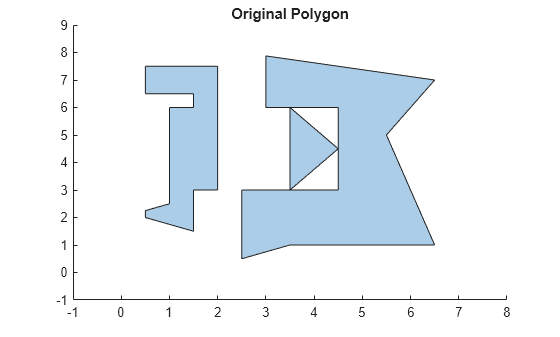
Load a polyshape and plot it.
load("exampleComplexPolyshape.mat","p")
plot(p)
title("Original Polygon")
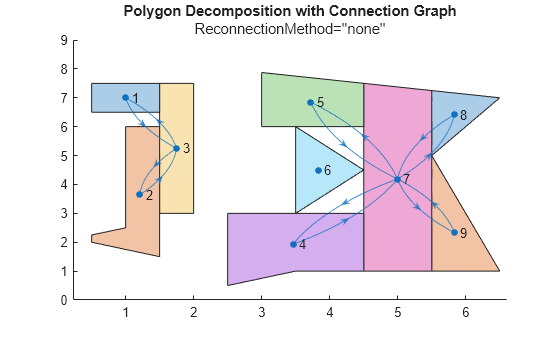
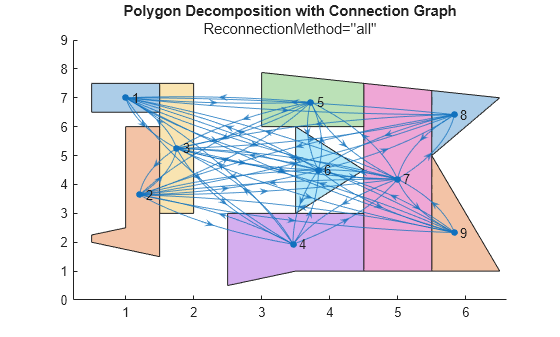
Decompose the polygon using each reconnection method.
bOpts1 = boustrophedonOptions(ReconnectionMethod="nearest");
[polySet1,info1] = polygonDecomposition(p,bOpts1);
bOpts2 = boustrophedonOptions(ReconnectionMethod="none");
[polySet2,info2] = polygonDecomposition(p,bOpts2);
bOpts3 = boustrophedonOptions(ReconnectionMethod="all");
[polySet3,info3] = polygonDecomposition(p,bOpts3);
Show the polygon decomposition with a connectivity graph overlay for each reconnection method.
plot(polySet1)
hold on
exampleHelperShowGraphConnectionsOnPolyset(polySet1,info1.Connectivity,0.5);
title("Polygon Decomposition with Connection Graph");
subtitle("ReconnectionMethod=''nearest''")
hold off

plot(polySet2)
hold on
exampleHelperShowGraphConnectionsOnPolyset(polySet2,info2.Connectivity,0.5);
title("Polygon Decomposition with Connection Graph");
subtitle("ReconnectionMethod=''none''");
hold off
plot(polySet3)
hold on
exampleHelperShowGraphConnectionsOnPolyset(polySet3,info3.Connectivity,0.5);
title("Polygon Decomposition with Connection Graph");
subtitle("ReconnectionMethod=''all''");
hold off
This is the helper function for plotting the polygon decomposition and overlaying the connectivity graph.
function gHandle = exampleHelperShowGraphConnectionsOnPolyset(polySet,connectionGraph,lineWidth)

    % Get the current axes
    ax = gca;
    ax.ColorOrderIndex = 1; % Reset the color order index

    % Overlay the connectivity graph
    gHandle = show(connectionGraph);
    gHandle.EdgeAlpha = 0.75;
    gHandle.LineWidth = lineWidth; % Set the line width for the graph edges

    % Calculate and plot the centroids
    [cx,cy] = centroid(polySet);

    % Set the xy-positions of the connectivity graph to the centroids of
    % the polygons
    gHandle.XData = cx';
    gHandle.YData = cy';
end
The polygonDecomposition function enables you to plan UAV coverage paths while accounting for areas that you do not need to include in coverage paths.
First, load the polygon as a polyshape representing the region to survey, and decompose the polygon into nonoverlapping convex polygons.
load("exampleCoveragePlanningPolyshape.mat","p")
polySet = polygonDecomposition(p);
Extract vertices from each decomposed polygons, and store them in a cell array.
polygonVertices = cell(numel(polySet),1);
for i = 1:numel(polySet)
    polygonVertices{i} = polySet(i).Vertices;
end
Create a uavCoverageSpace object with the decomposed polygon vertices, and visualize the coverage space.
space = uavCoverageSpace(Polygons=polygonVertices);
ax = show(space,FontSize=1,LineWidth=0.25);
title("UAV Coverage Space");
axis padded
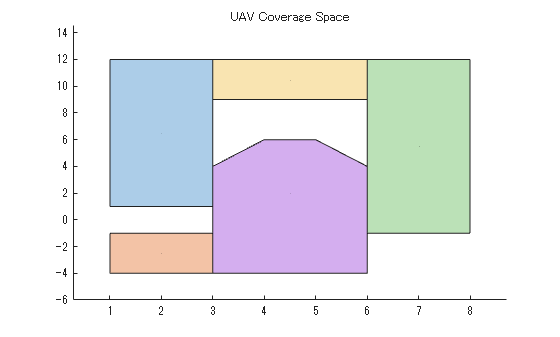
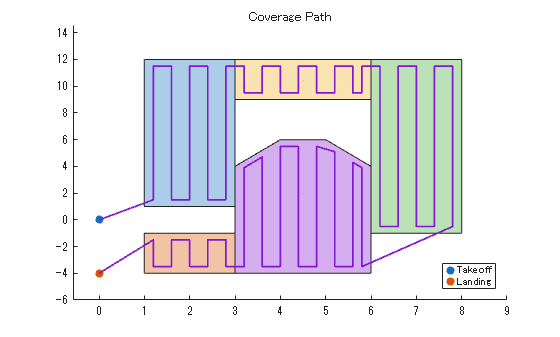
space.UnitWidth = 0.4; % Sensor footprint widthCreate a uavCoveragePlanner object. Specify the takeoff and landing positions, and then plan the coverage path.
planner = uavCoveragePlanner(space);
takeoff = [0 0 0];
landing = [0 -4 0];
path = plan(planner,takeoff,landing);
Visualize the planned path on the coverage space.
hold on
ax.ColorOrderIndex=1;
h1 = scatter(takeoff(1),takeoff(2),"filled");
h2 = scatter(landing(1),landing(2),"filled");
Plot the planned coverage path.
ax.ColorOrderIndex=4;
plot(path(:,1),path(:,2),LineWidth=1.25)
legend([h1 h2],"Takeoff","Landing",Location="southeast")
title("Coverage Path")
hold off
Input Arguments
Output Arguments
References
[1] Choset, Howie. "Coverage of Known Spaces: The Boustrophedon Cellular Decomposition." Autonomous Robots 9, no.3 (2000): 247–53. https://doi.org/10.1023/A:1008958800904.
Extended Capabilities
Version History
Introduced in R2025a