colormaplist
Syntax
Description
cmaps = colormaplist returns a list of available colormaps as an
m-by-1 string array.
Examples
Return a list of colormaps.
cmaps = colormaplist
cmaps =

  21×1 string array

    "parula"
    "turbo"
    "hsv"
    "hot"
    "cool"
    "spring"
    "summer"
    "autumn"
    "winter"
    "gray"
    ...
Create a function that returns the RGB triplets defined in a specific colormap.
Return a list of colormaps.
cmaps = colormaplist
cmaps =

  21×1 string array

    "parula"
    "turbo"
    "hsv"
    "hot"
    "cool"
    "spring"
    "summer"
    "autumn"
    "winter"
    "gray"
    ...
Use str2func to define a function that returns
the first n RGB triplets in the turbo
colormap.
cmapFcn = str2func(cmaps(2))
cmapFcn =

  function_handle with value:

    @turbo
Use cmapFcn to list the first five RGB triplets in
turbo.
cmapFcn(5)
ans =

    0.1900    0.0718    0.2322
    0.1602    0.7332    0.9252
    0.6384    0.9910    0.2365
    0.9853    0.5018    0.1324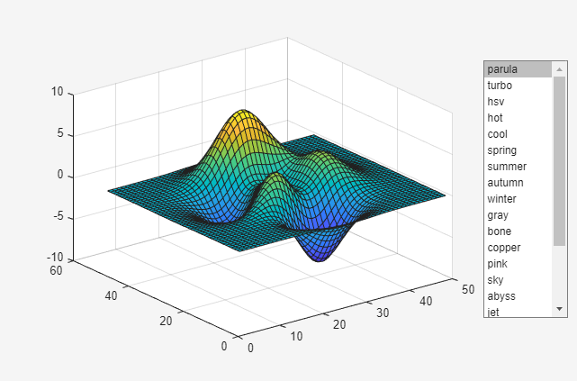
0.4796 0.0158 0.0106The plotwithcolormaps function creates an axes object and plots a
surface in the axes. The function also creates a list box and uses the results from a call
to colormaplist to populate the list.
function plotwithcolormaps
    f = uifigure;
    ax = axes(f,Units="pixels",Position=[180 100 500 400]);
    cmaps = colormaplist;
    uilistbox(f,Position=[750 200 120 320],Items=cmaps,...
        ValueChangedFcn=@applycmap);
    surf(ax,peaks)

    function applycmap(src,~)
        colormap(src.Parent,src.Value)
    end
end
Save and run plotwithcolormaps. Change the colormap of the
graph by selecting an option from the list box.
plotwithcolormaps
Version History
Introduced in R2025a